23
FUELS & LUBES INTERNATIONAL
Quarter Four 2014
IndIa’s oIl sector has
largely been under government
control since 1956, when the
oil industry was classified as
“schedule a,” which meant that
the government would con-
trol all its operations. then, in
1959, an act of Parliament gave
the oil and natural Gas corp.
(onGc) regulatory authority.
It was only after 1991, in a more
liberal climate, when private
players came into the picture.
controls were loosened and
private participation was al-
lowed both in the upstream and
downstream segments.
More than 20 years later,
state-owned public sector under-
takings (PsUs) still dominate the
refining segment, while reliance
Industries ltd. and essar oil
ltd., the main private players,
are focused on exports rather
than the domestic markets.
even after liberalization,
the government continued
In FY 2014, government
subsidies are expected to touch
Inr140 thousand crore (Usd
23 billion), 36% of which is the
diesel fuel component.
Diesel RegulatoRy
stanDaRDs
recent surveys, such as those
by the World health organiza-
tion (Who), ranked the Indian
capital, new delhi, as having the
“world’s worst air quality” with
PM2.5 and PM10, annual means
at 153 μg/m
3
and 286 μg/m
3
,
respectively, way above Who’s
acceptable norms of 10 μg/m
3
and 20 μg/m
3
, respectively.
a major pollutant in diesel
fuel is sulphur. In 1995, the
sulphur content of diesel was
more than 10,000 parts per mil-
lion (ppm) nationwide. today,
the maximum allowable sulphur
content in diesel fuel in the
national capital region (delhi)
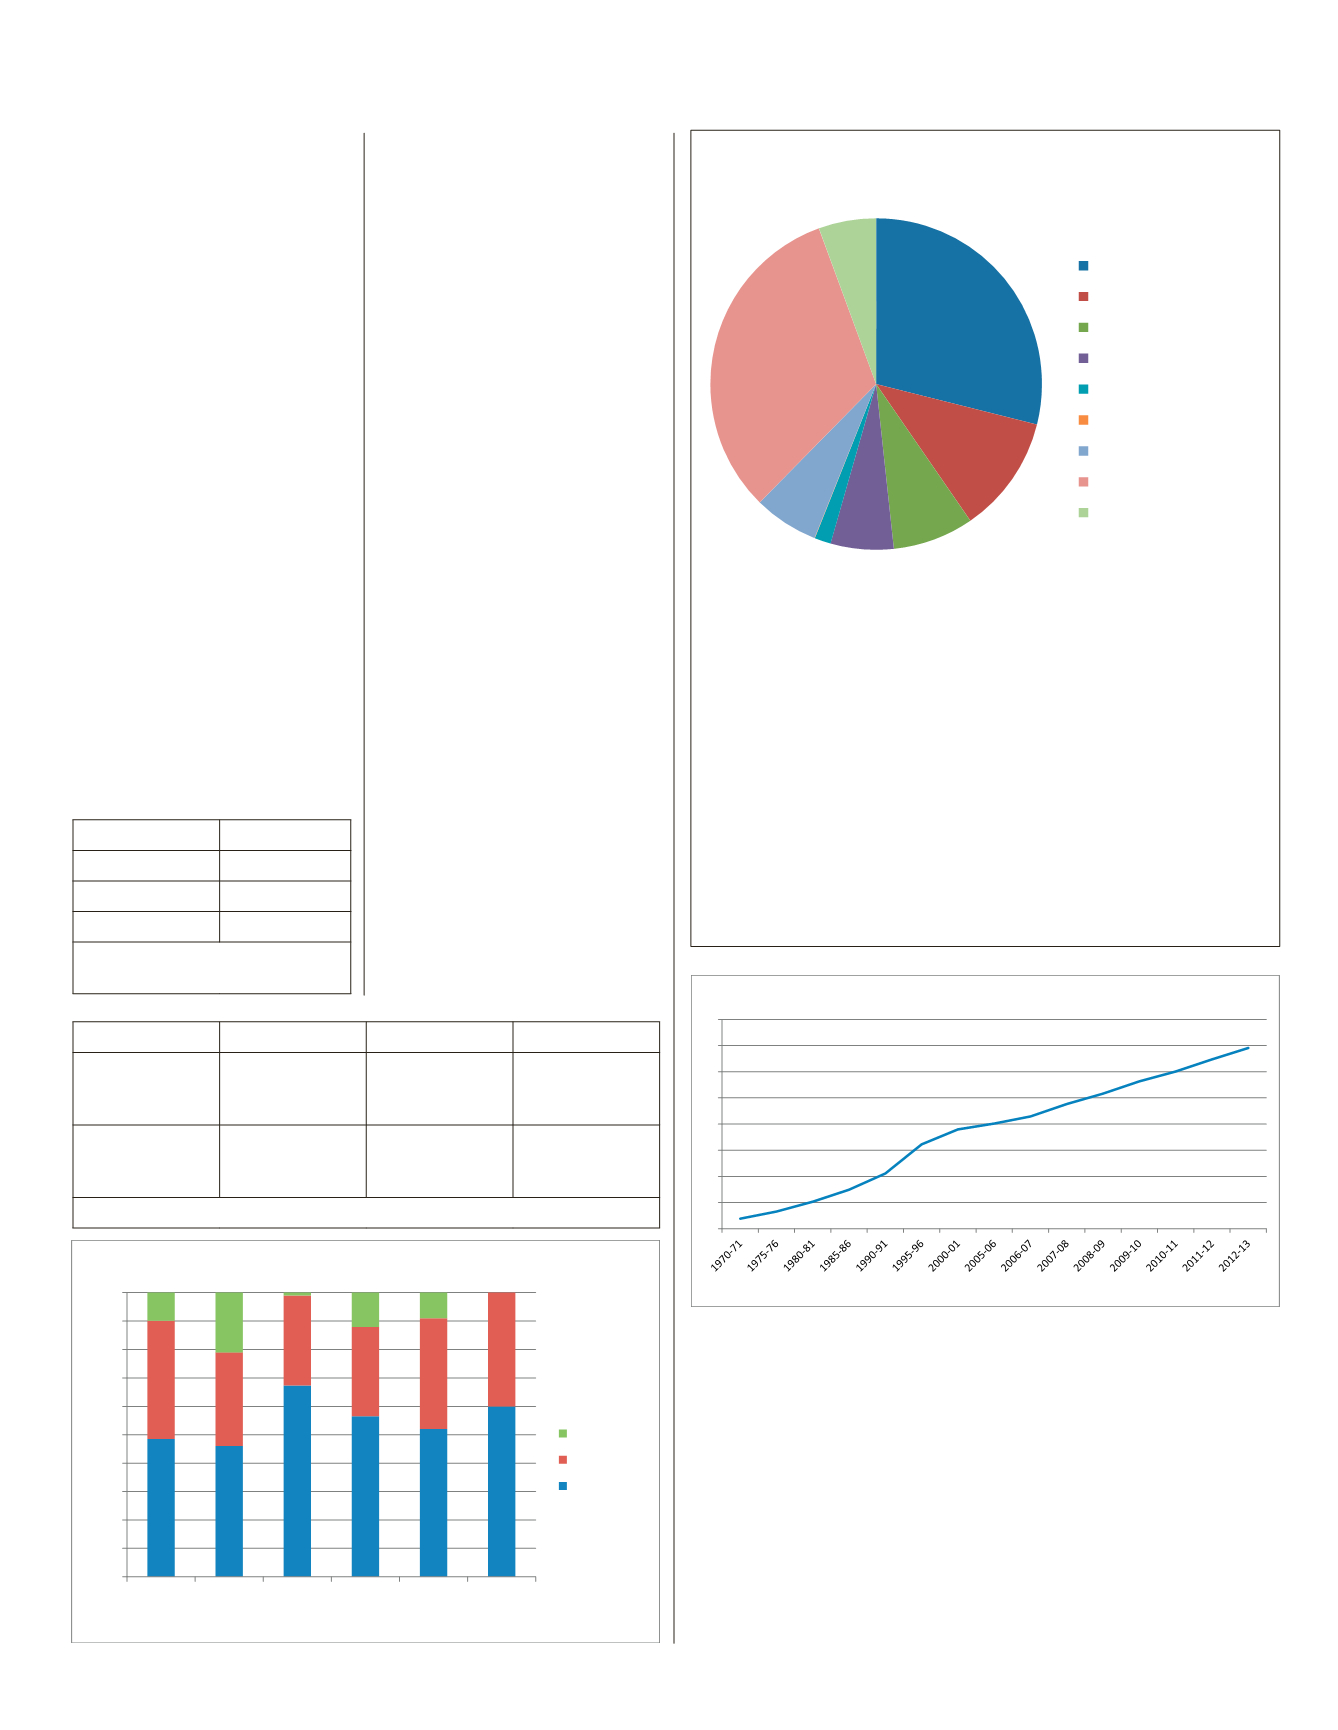
Public vs Private Sector Capacity
Source: Central Statistics Office, Govt of India
IOC (Public)
BPCL (Public)
HPCL (Public)
CPCL (Public)
NRL (Public)
ONGC (Public)
MRPL (Public)
Reliance (Private)
Essar (Private)
Public vs Private Sector Capacity
Source: Central Statistics Office, Govt of India
IOC (Public)
BPCL (Public)
HPCL (Public)
CPCL (Public)
NRL (Public)
ONGC (Public)
MRPL (Public)
Reliance (Private)
Essar (Private)
Installed Capacity (TMTPA*)
54,200
21,500
14,800
11,500
3,000
66
11,820
60,000
10,500
Refinery
IOC (Public)
BPCL (Public)
HPCL (Public)
CPCL (Public)
NRL (Public)
ONGC (Public)
MRPL (Public)
Reliance (Private)
Essar (Private)
* Thousand metric tonnes per annum
3.84 6.6
10.35
14.89
21.14
32.26
37.96 40.19 42.9
47.67
51.67
56.32
60.07
64.75
69.08
0
10
20
30
40
50
60
70
80
Source: Petroleum Planning and Analysis Cell, Government of India
Diesel Consumption (million tons)
0%
10%
20%
30%
40%
50%
60%
70%
80%
90%
100%
2006-07 2007-08 2008-09 2009-10 2010-11 2011-12
Source: Oxford Institute for Energy Studies
Under Recoveries Sharing Structure
OMC
Upstream
Government
Bs ii
Bs iii
Bs iV
implementation
Date
2001 (selected
cities), 2005
(nationwide)
2005 (selected
cities), 2010
(nationwide)
2010 (selected
cities)
total sulphur,
max mg/kg
(ppm)
500
350
50
Source: Central Pollution Control Board , Government of India
emission norms PM (g/km)
BS4
0.06
BS5
0.0045
% less
93
Source: International Refereed
Journal of Engineering and Science
to subsidize and control the
prices of petroleum products.
In 2002, it took important steps
for a phased dismantling of the
administered Price Mechanism.
Yet economic and political
ramifications ensure that diesel
fuel prices will continue to be
partly regulated even though
petrol prices are near parity
with market prices. a sudden
increase in diesel cost could
have been detrimental to certain
sectors, freight and agricultural
in particular, hence the decision
to hike diesel prices slowly over
time.
as a result of being cheaper
than petrol, diesel fuel became
the transport fuel of choice.
thus, India’s diesel fuel con-
sumption has risen steadily with
a compounded annual growth
rate (caGr) of 7% for the past
three and a half decades.
diesel fuel subsidies have
distorted the market, especially
after 2010 when petrol prices
were deregulated. this led to an
artificial advantage for diesel
fuel: as people opted for the
cheaper fuel, the diesel compo-
nent of the subsidy increased
further. diesel fuel consumption
rose from 56.32 million tonnes
to 69.08 million tonnes between
FY 2009-10 and FY 2012-13.
Source: Oxford Institute for Energy Studies
Source: Petroleum Planning and Analysis Cell, Government of India
Source: Central Statistics Office, Government of India
under Recoveries s ring structure
Public vs Private sector Capacity
Diesel Consumption ( illion tonnes)
23
FUELS & UBES INTER ATIONAL
Quarter Four 2014
Ind a’s oIl sector has
large y b en under governme t
contr l since 1956, when t
oil industry was cl ssified as
“schedul a,” which meant tha
the gov rnme t would con-
trol all its operations. then, in
1959, an act of Parliament gave
the oil and natural Gas corp.
(onGc) regulatory authori y.
It was only after 1991, in a more
liberal climate, wh n private
players came into the picture.
contr ls were loosened and
private p rticipation was al-
lowed both in t e upstream and
downstream seg ents.
More than 20 years later,
state-owned public sector under-
takings (PsUs) till dominate the
refining segment, while reliance
Industrie ltd. an essar oil
ltd., the main pr vate players,
are focused on exports rathe
than t e domestic markets.
even after lib alization,
the gov rnme t co inued
In FY 2014, governme t
subsidie ar exp cted to touch
Inr140 thousand crore (Usd
23 billion), 36% of which is t e
diesel fu l comp nent.
Diesel RegulatoRy
stanDaRDs
recent surveys, such as t o e
by the World health organiz -
tion (Who), ranked th India
capital, new d lhi, as having the
“world’s worst ai quality” with
PM2.5 and PM10, annu l means
at 153 μg/m
3
and 286 μg/m
3
,
respectiv ly, wa above Who’s
acceptable norms of 10 μg/m
3
and 20 μg/m
3
, respectiv ly.
a major pollutant in diesel
fuel is sulph r. In 1995, the
sulph r content of diesel was
more than 10,00 parts per mil-
lion (ppm) natio w de. today,
the maxi um allowable su ph r
content in diesel fu l in the
nation l capital region (delhi)
Public vs Private Sector Capacity
Source: Central Statistics Office, Govt of India
IOC (Public)
BPCL (Public)
HPCL (Public)
CPCL (Public)
NRL (Public)
ONGC (Public)
MRPL (Public)
Relianc (Private)
Essar (Private)
Public vs Private Sector Capacity
Source: Central Statistics Office, Govt of India
IOC (Public)
BPCL (Public)
HPCL (Public)
CPCL (Public)
NRL (Public)
ONGC (Public)
MRPL (Public)
Relianc (Private)
Essar (Private)
Installed Capacity (TMTPA*)
54,200
21,500
14,800
11,500
3,000
66
11,820
60,000
10,500
Refinery
IOC (Public)
BPCL ( ublic)
HPCL ( ublic)
CPCL ( ublic)
NRL (Public)
ONGC (Public)
MRPL (Public)
Reliance (Private)
Essar (Private)
* Thousand metric tonnes per annum
3.84 6.6
10.35
14.89
21.14
32.26
37.96 40.19 42.9
47.67
51.67
56.32
60.07
64.75
69.08
0
10
20
30
40
50
60
70
80
Source: Petrol um Planning and A alysis Cel , Government of India
Diesel Consumption (million tons)
0%
10%
20%
30%
40%
50%
60%
70%
80%
90%
100%
2006-07 2 07-08 2 08-09 2 09-10 2010-11 20 1-1
Source: Oxford Institute for Energy Studies
Under Recoveries Sharing Structure
OMC
Upstream
Government
Bs ii
Bs iii
Bs iV
implementation
Date
2001 (selected
cities), 2005
(natio wide)
2005 (selected
cities), 2010
(natio wide)
2010 (selected
cities)
total sulph r,
max g/kg
(ppm)
500
350
50
Source: Central Polluti n Control Board , Governm nt of I dia
emission n rms PM (g/km)
BS4
0.06
BS5
0.0045
% less
93
Source: Interna io l Refere d
Journal of Engineeri g and Science
to subsidize and contr l the
prices of petrol um products.
In 2002, it took important steps
for a phased dismantling of the
administered P ice Mechanism.
Yet economic and politica
ramifications ensure that diesel
fuel prices will continue to be
partly regulated ev n thoug
petrol p ices ar near parity
with market prices. a sudden
increase in diesel cost uld
have been detrimental to certain
sectors, freight and gricultura
in particular, hence the decision
to hike d esel prices slowly ver
time.
as a re ult of being cheaper
than petrol, diesel fu l becam
the transport fuel of ch ice.
thus, India’s e el fu l con-
sumption has risen st adily w th
a comp unded annu l growth
rate (caGr) of 7% or the past
three and half deca s.
diesel fu l s bsidie have
distorted th market, especially
after 2010 when petrol p ices
were d gulated. this led to an
artificial advantage for diesel
fuel: as people t d for the
cheaper fu l, th diesel comp -
nent of the subsidy increased
further. diesel fu l consumption
rose from 56.32 million ton es
to 69.08 million ton es b twe n
FY 2009-1 and FY 2012-13.
Source: Oxford Institute for Energy Studies
Source: Petroleum Planning and Analysis Cell, Governm nt of I dia
Source: Central Statistics Office, Gov rnm nt of I dia
under R coveries s aring struc ure
Public vs Private s ctor Cap city
Diesel Consumption (million t nes)


