bp Energy Outlook 2024: From addition to substitution


On July 10 at bp’s headquarters in St. James, London, UK, Chief Economist Spencer Dale presented the results of the bp Energy Outlook 2024. The webcast attracted more than 20,000 attendees from around the world.
The bp Energy Outlook is an annual report published by the British energy major, offering insights into the future of global energy markets. The inaugural bp Energy Outlook was published in 2011, reflecting on the growing challenges of climate change as the average global temperature was 0.51 degrees Celsius warmer than a mid-20th century baseline.
During his presentation, Dale noted that despite the passage of time and the emergence of new energies and technologies, many profiles and analyses from the original outlook remain relevant, particularly for well-established fuels such as oil, natural gas, and hydropower.
Key themes: Energy security and sustainability
Two overarching themes in the first outlook were energy security and sustainability. In 2011, a massive earthquake triggered a major nuclear accident at the Fukushima Daiichi power plant in Japan. The disaster demonstrated the value of globally integrated energy markets as Japan faced a colossal energy shortfall, relying on liquefied natural gas (LNG) from Europe. A decade later, Japan continues to grapple with energy security issues.
The themes of energy sustainability and security continue to shape the energy landscape in the 2024 edition of the outlook, particularly against the backdrop of Russia’s war in Ukraine. The report underscores the risks of dependence on imports and highlights the benefits of domestically produced energy or sourcing from reliable international partners.
Scenarios for the future: Current trajectory vs. net zero
The 13th edition includes two key scenarios outlining how the global energy system might evolve. The “Current Trajectory” (CT) scenario is based on existing climate policies and future decarbonisation pledges, while the “Net Zero” scenario details the necessary evolution to achieve faster emissions reductions, considering climate policies, societal behaviours, and preferences.
In the CT scenario, CO2 equivalent (CO2e) emissions stop rising by mid-decade, followed by shallow decarbonisation, leaving emissions 25% below 2022 levels by 2050. The Net Zero scenario outlines a more aggressive path, reducing CO2e emissions by around 95% by 2050.
“We can’t predict the future,” said Dale, emphasising that neither scenario will truly reflect the transition path. However, these scenarios can help inform strategies to prepare for future uncertainties in energy market development through 2050.
Dale highlighted three common trends across the CT and Net Zero scenarios, including a historic shift from energy addition to energy substitution. Historically, landmark energy shifts, such as coal supplanting biomass, involved increased consumption of all fuels. Currently, we are in an energy addition phase where both unabated fossil fuels and low-carbon energy are growing. Dale stressed the importance of shifting to energy substitution to reduce carbon emissions.
In the CT scenario, energy addition continues through the 2020s due to the resilience of fossil fuel energy. Energy substitution remains limited in the 2030s and 2040s, with unabated fossil fuels still comprising two-thirds of primary energy in 2050, down from 80% today. In contrast, the Net Zero scenario envisions a faster transition, with unabated fossil fuels comprising less than 20% of primary energy by 2050.
Another trend is the rapid growth in electricity led by wind and solar power. Currently, around 20% of global final energy consumption is electrified. This figure reaches 35% by 2050 in the CT scenario and more than 50% in the Net Zero scenario. Wind and solar power are projected to account for 50% to 70% of electricity generation by 2050, with most growth occurring in emerging economies.
Oil continues to play a central role in the global energy system, but both scenarios project declining demand. Today, the world consumes between 80 and 100 million barrels per day (bpd) of oil. In the CT scenario, oil demand remains stable until 2035, then gradually declines to 75 million bpd by 2050. In the Net Zero scenario, oil demand falls drastically to between 25 and 30 million bpd by 2050, a 70% reduction from current levels.
The decline in oil use is primarily driven by greater vehicle efficiency and electrification trends. Currently, road transport consumes about 40 million bpd of oil. Both scenarios forecast a drop to between five and 25 million bpd by 2050.
Dale also highlighted key differences between the two scenarios, particularly in natural gas usage. In the CT scenario, natural gas use increases by 25% by 2050. In contrast, the Net Zero scenario projects a sharp decline, with natural gas usage dropping to half its current level by 2050 due to increased electrification in emerging markets. Increasing use in the industrialisation of emerging economies is a driving force in both scenarios.
LNG, a preferred source of natural gas in emerging economies, faces similar uncertainties, with demand increasing by 80% in the CT scenario but falling by 40% in the Net Zero scenario. These uncertainties affect investments in long-lived energy production facilities.
The role of low-carbon technologies
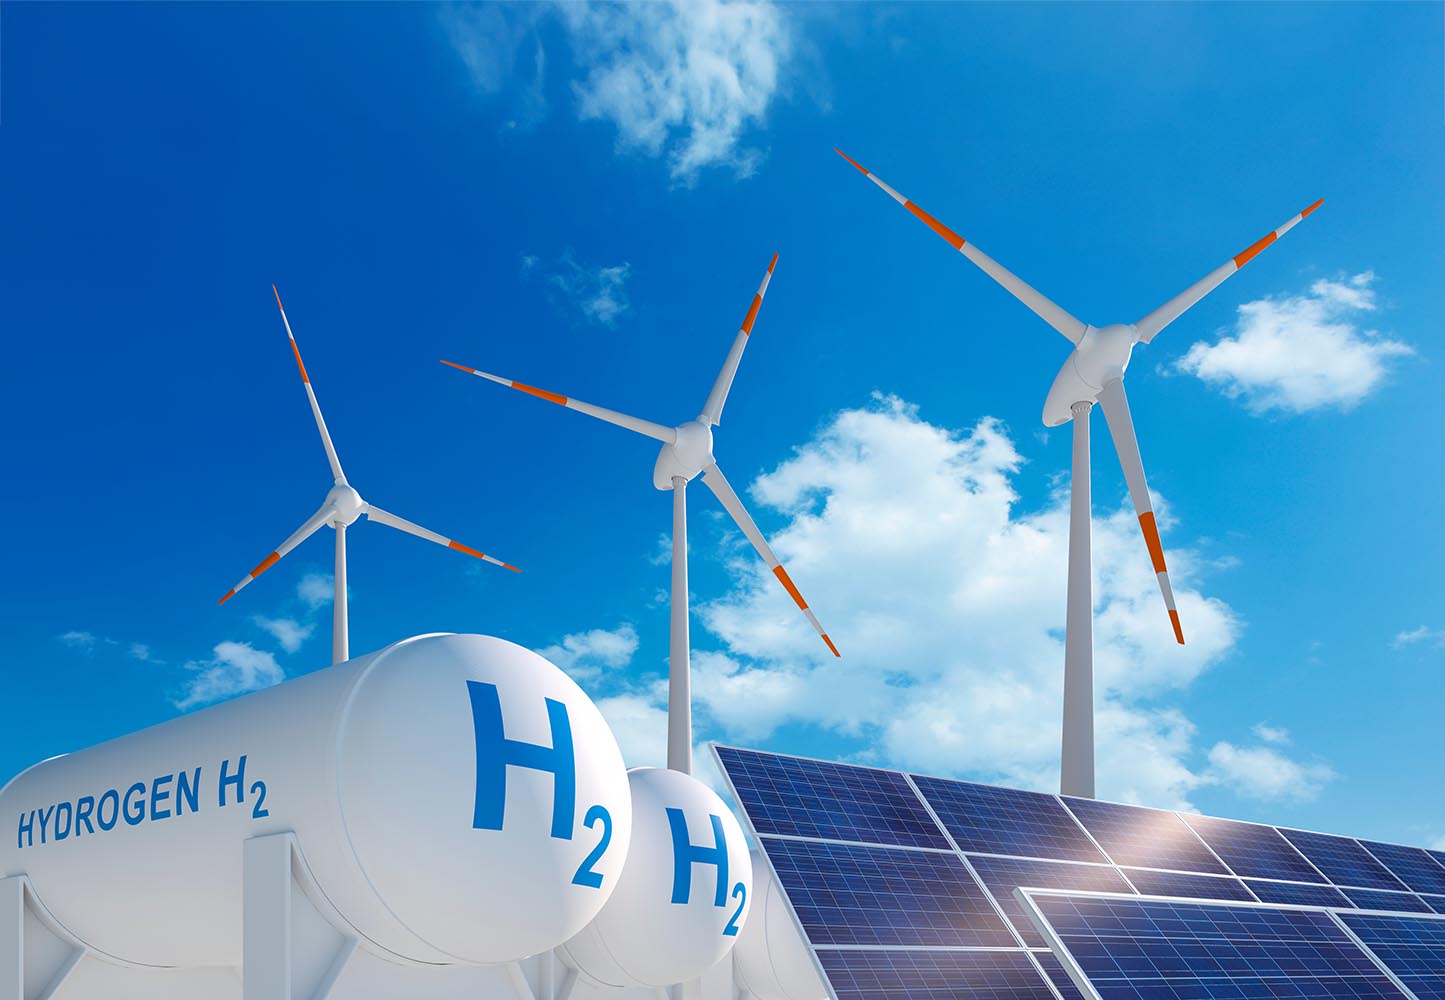
Another key difference between the two scenarios is the use of low-carbon energy technologies for hard-to-electrify applications. In the Net Zero scenario, low-carbon hydrogen is projected to reach 400 million tons per annum by 2050, five times higher than current demand for grey hydrogen. Low-carbon hydrogen also plays a significant role in long-distance transport and heavy industry. In contrast, the CT scenario projects much lower levels of low-carbon hydrogen adoption, with grey hydrogen still satisfying two-thirds of industrial feedstock. Sustainable aviation fuel (SAF) is expected to comprise almost 80% of total jet fuel in Net Zero by 2050, compared to only 20% in CT.
Despite the ambitious decarbonisation goals, low-carbon technologies only begin to significantly increase in the second half of the outlook period. The pace and extent of their adoption depend on society’s willingness to bear additional costs in the near term.
Since the Paris Agreement in 2015, global carbon emissions have continued to rise, aside from a temporary drop during the Covid-19 pandemic. The CT scenario is not aligned with the Paris Agreement goals, and delaying decarbonisation will make the transition more difficult and costly.
The biggest difference between the two scenarios is the pace of decarbonising global power systems. There is a 40% difference in the speed of decarbonisation, with a 15-year lag in the decarbonisation of power systems in the CT pathway. The main factor accounting for this difference is the pace at which emerging economies decarbonise their power systems. Emerging countries are entrenched in the energy addition phase, experiencing strong growth in power demand.
Dale identified four key areas of focus to assist with a shift to Net Zero. He emphasised the need for a global focus—not just within developed countries—to support emerging economies. The bp representative underscored the importance of energy efficiency, which is often overlooked in policy discussions, and pointed to the continued uptick in the electrification of the energy system.
Lastly, Dale stressed that application, not invention, is a key factor. Significant differences between CT and Net Zero do not stem from new inventions or technological breakthroughs, but rather from known technologies such as wind and solar in power markets, electrification, low-carbon hydrogen and CCUS. There is a critical need for faster and wider adoption of these technologies through policy incentives and support to drive faster and more widespread adoption.