
California Resources Corporation Announces Third Quarter 2017 Results


LOS ANGELES–(BUSINESS WIRE)–California Resources Corporation (NYSE:CRC), an independent
California-based oil and gas exploration and production company, today
reported a net loss attributable to common stock (CRC net loss) of $133
million, or $3.11 per diluted share, for the third quarter of 2017,
compared with net income attributable to common stock (CRC net income)
of $546 million, or $13.04 per diluted share, for the third quarter of
2016. The adjusted net loss1 for the third quarter of 2017
was $52 million, or $1.22 per diluted share, compared with an adjusted
net loss1 of $71 million, or $1.74 per diluted share, for the
third quarter of 2016. For the first nine months of 2017, the CRC net
loss was $128 million, or $3.01 per diluted share, compared with CRC net
income of $356 million, or $8.79 per diluted share, for the same period
in 2016. The adjusted net loss1 for the first nine months of
2017 was $173 million, or $4.07 per diluted share, compared with an
adjusted net loss1 of $243 million, or $6.12 per diluted
share, for the same period in 2016.
Adjusted EBITDAX1 for the third quarter of 2017 was $181
million compared with $164 million for the third quarter of 2016.
Adjusted EBITDAX1 for the first nine months of 2017 was $539
million compared with $448 million for the same period in 2016. Cash
provided by operations was $225 million for the first nine months of
2017. Capital investments for the third quarter of 2017 were $100
million and $232 million for the first nine months of 2017, of which $30
million was funded by CRC's joint venture (JV) partner Benefit Street
Partners (BSP) in the third quarter and $82 million in the first nine
months. After excluding the capital that was funded by BSP, CRC
generated free cash flow1 of $101 million for the first nine
months of 2017.
Quarterly Highlights Include:
- Produced approximately 128,000 BOE per day
-
Invested capital of $100 million, of which JV partner BSP funded $30
million -
Drilled 28 wells with internally funded capital and 49 wells with JV
capital -
Received approval for a bank amendment, subject to certain conditions
being met, which would extend the maturity of our credit facility and
relax financial covenants, among other changes - Borrowing Base reaffirmed at $2.3 billion
-
Generated adjusted EBITDAX1 of $181 million, reflecting an
adjusted EBITDAX margin1 of 35%
1 See Attachment 2 for explanations of how we calculate and
use the non–GAAP measures of Adjusted EBITDAX, Adjusted EBITDAX margin,
Free Cash Flow and Adjusted Net Loss, and for reconciliations of the
foregoing to their nearest GAAP measure as applicable.
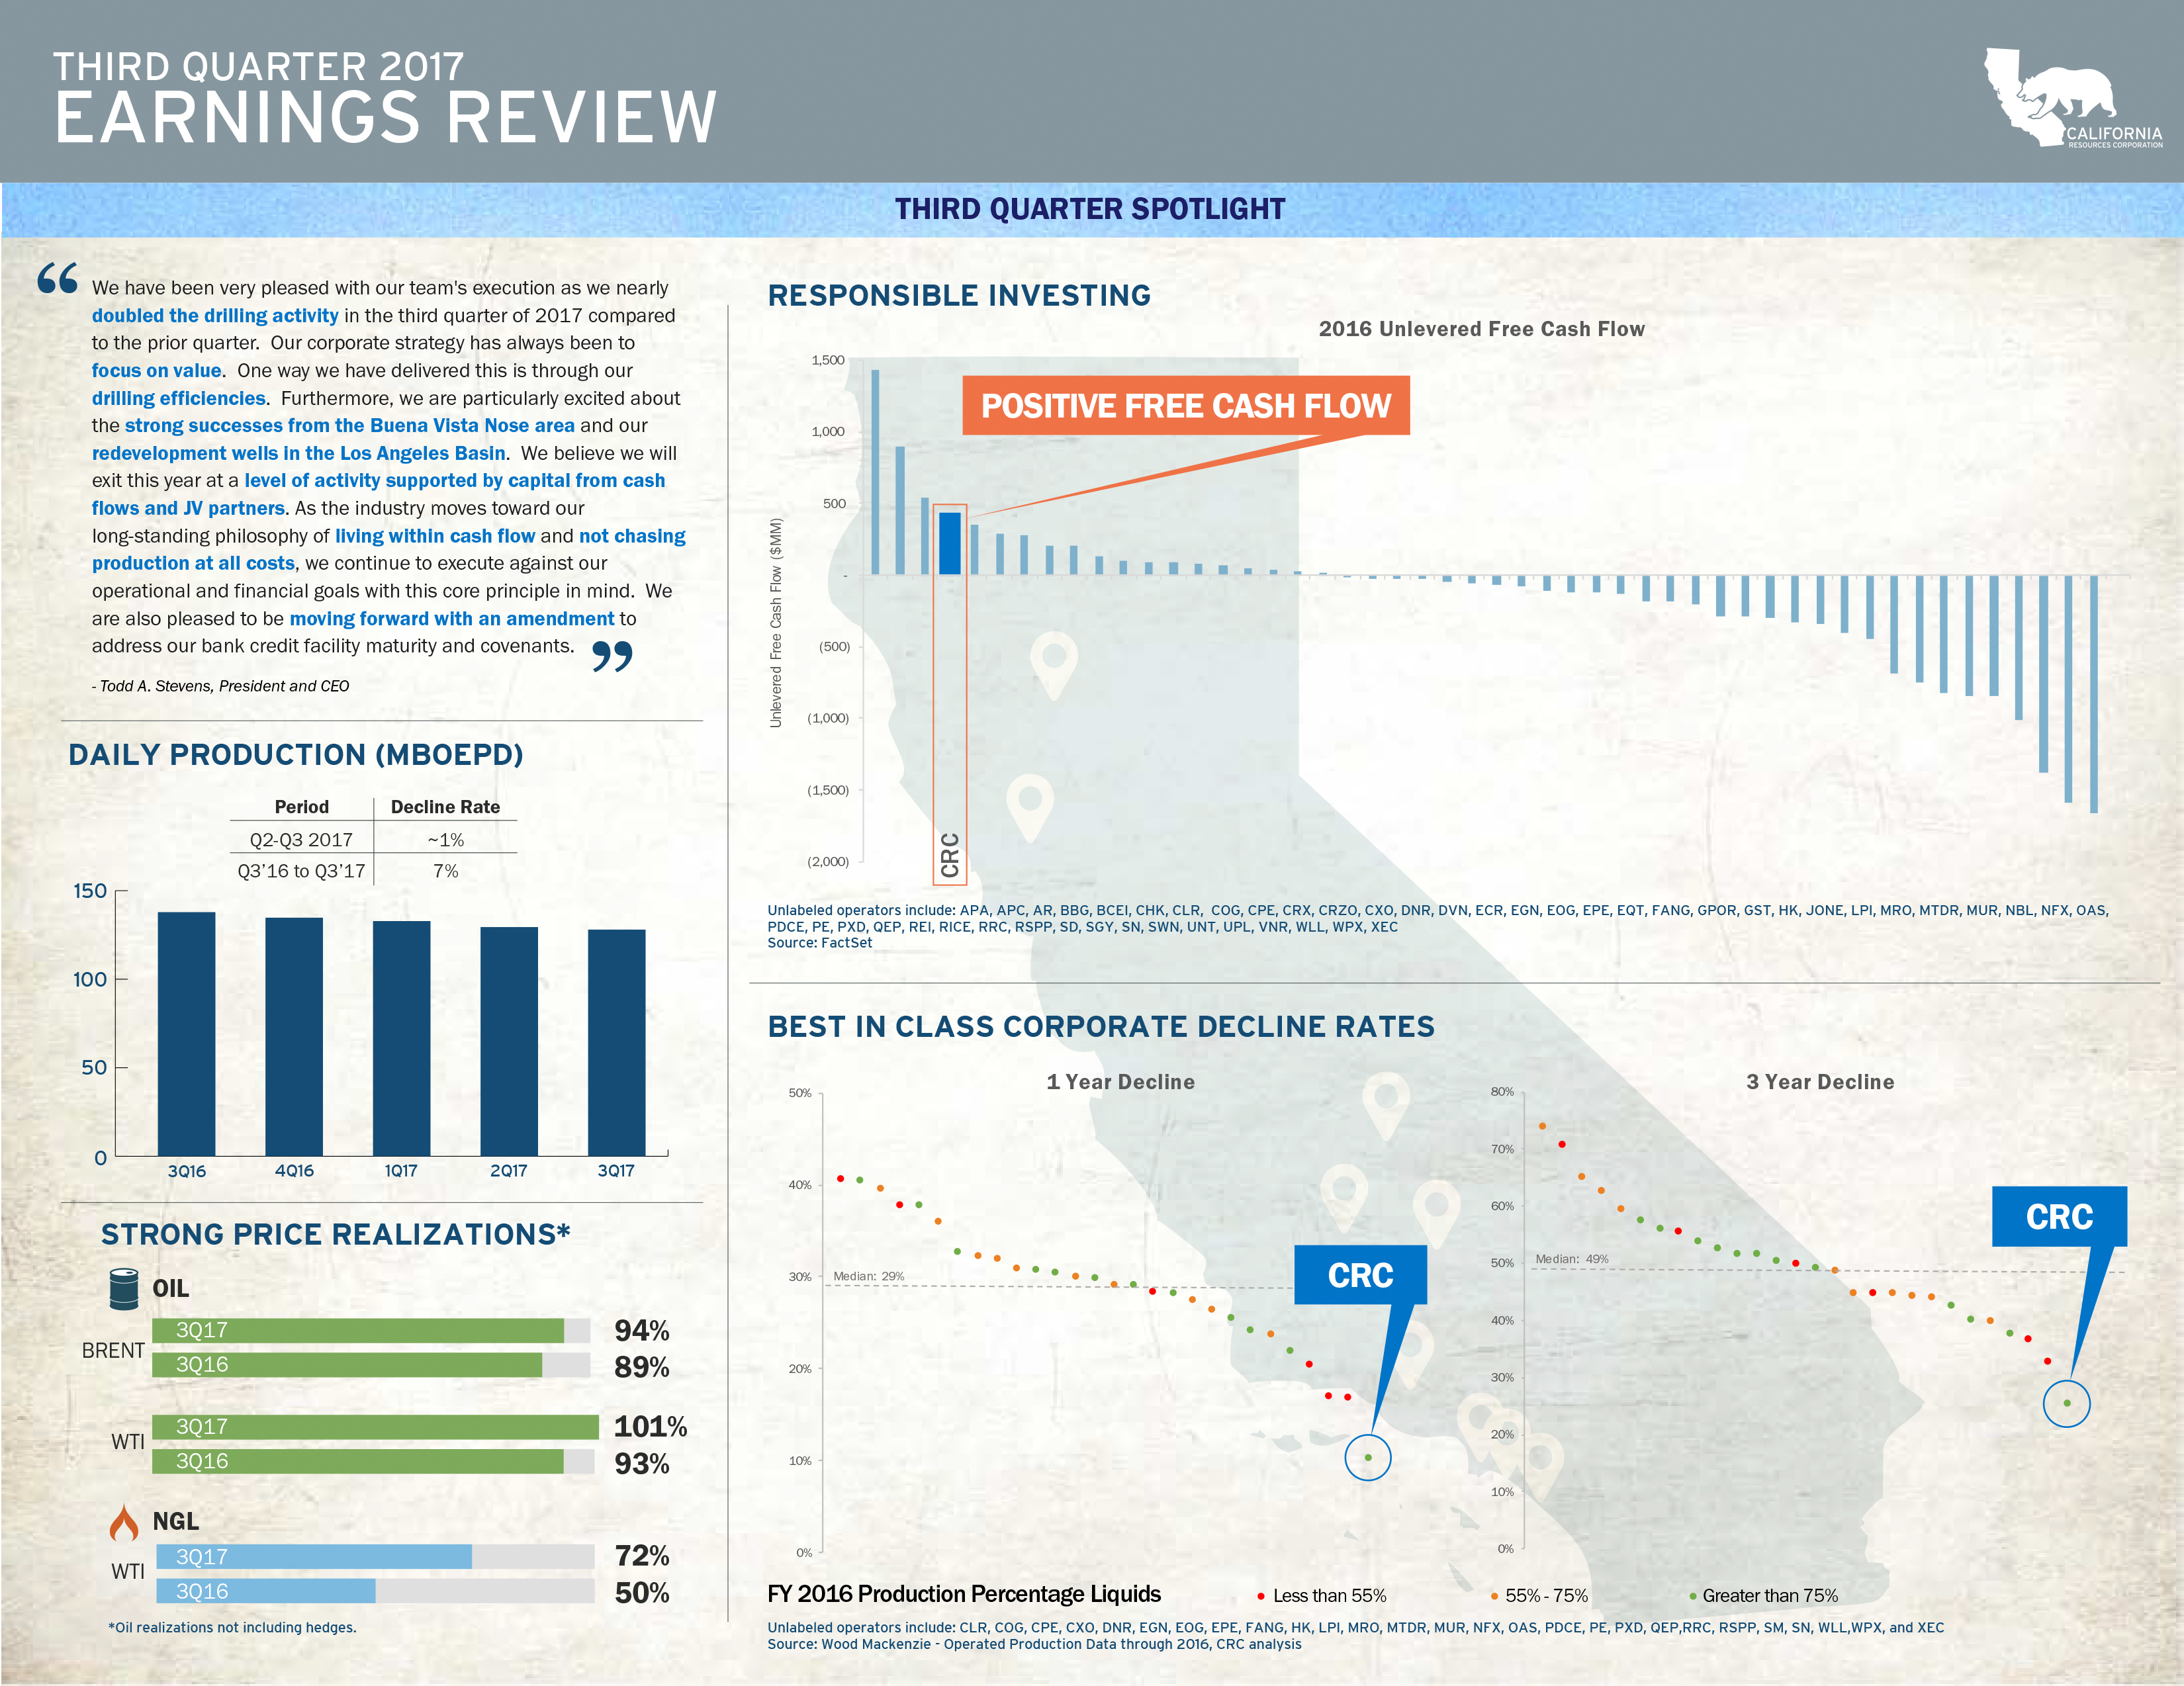
Todd Stevens, President and Chief Executive Officer, said, "We have been
very pleased with our team's execution as we nearly doubled the drilling
activity in the third quarter of 2017 compared to the prior quarter. Our
corporate strategy has always been to focus on value. One way we have
delivered this is through our drilling efficiencies. Furthermore, we are
particularly excited about the strong successes from the Buena Vista
Nose area and our redevelopment wells in the Los Angeles Basin. We
believe we will exit this year at a level of activity supported by
capital from cash flows and JV partners. As the industry moves toward
our long-standing philosophy of living within cash flow and not chasing
production at all costs, we continue to execute against our operational
and financial goals with this core principle in mind. We are also
pleased to be moving forward with an amendment to address our bank
credit facility maturity and covenants."
Third Quarter Results
For the third quarter of 2017, the CRC net loss was $133 million, or
$3.11 per diluted share, compared with CRC net income of $546 million,
or $13.04 per diluted share, for the same period of 2016. Operational
results were stronger year over year due to higher oil and gas sales
partially offset by higher production costs from increased downhole
maintenance activity. Non-operating income reflected a gain in the third
quarter of 2016 from debt-reduction actions. The third quarter 2017
adjusted net loss2 was $52 million, or $1.22 per diluted
share, compared with an adjusted net loss2 of $71 million, or
$1.74 per diluted share, for the same period of 2016. The third quarter
2017 adjusted net loss2 excluded $72 million of non-cash
derivatives losses and a net $9 million charge for other unusual and
infrequent items. The third quarter 2016 adjusted net loss2
excluded $660 million of gains related to repurchases of the Company's
notes, $25 million of non-cash derivatives losses, a $12 million
interest charge for the write-off of deferred debt costs, and a $6
million charge for other unusual and infrequent items.
Total daily production volumes averaged 128,000 barrels of oil
equivalent (BOE) per day for the third quarter of 2017, a decrease of 7
percent from 138,000 BOE per day for the third quarter of 2016. Total
daily production decreased 1,000 BOE per day, or less than 1 percent,
from the second quarter of 2017.
In the third quarter of 2017, realized crude oil prices, including the
effect of settled hedges, increased $6.99 per barrel to $50.02 per
barrel from $43.03 per barrel in the prior year comparable quarter.
Settled hedges increased realized crude oil prices by $1.12 per barrel
in the third quarter of 2017 compared with $1.30 per barrel in the prior
year comparable quarter. Realized NGL prices increased 54 percent to
$34.63 per barrel from $22.45 per barrel in the third quarter of 2016
due to higher exports and low inventories. Realized natural gas prices
decreased 3 percent to $2.56 per thousand cubic feet (Mcf), compared
with $2.64 per Mcf in the same period of 2016.
Production costs for the third quarter of 2017 were $222 million, or
$18.90 per BOE, compared with $211 million, or $16.63 per BOE, for the
third quarter of 2016. The industry practice for reporting production
sharing-type contracts (PSCs) can result in higher production costs per
barrel as gross field operating costs are matched with net production.
Excluding the PSC effects, per unit production costs would have been
$17.81 and $15.63 for the third quarter of 2017 and 2016, respectively.
The increase in production costs was driven by the ramp-up of downhole
maintenance activity in line with stronger commodity prices. Adjusted
general and administrative (G&A) expenses for the third quarter of 2017
were $62 million, compared with $57 million for the third quarter of
2016. The increase in adjusted G&A expenses was a result of higher costs
of performance-based bonus and incentive compensation plans due to
better than expected results.
Taxes other than on income of $39 million for the third quarter of 2017
were $2 million higher than the same period of 2016. Exploration expense
of $5 million for the third quarter of 2017 was also $2 million higher
than the same period of 2016.
Capital investment in the third quarter of 2017 totaled $100 million,
consisting of $70 million of CRC internally funded capital and $30
million of BSP capital. Approximately $81 million was directed to
drilling and capital workovers.
Cash provided by operations for the quarter of 2017 was $105 million and
free cash flow2 was $35 million after excluding capital
funded by BSP.
2 See Attachment 2 for explanations of how we calculate and
use the non-GAAP measures of Adjusted Net Loss and Free Cash Flow, and
for reconciliations to the nearest GAAP measurement, as applicable.
Nine-Month Results
For the first nine months of 2017, the CRC net loss was $128 million, or
$3.01 per diluted share, compared with CRC net income of $356 million,
or $8.79 per diluted share, for the same period of 2016. Operational
results were stronger year over year due to higher revenue partially
offset by an increase in production costs resulting from increased
activity and higher gas and electricity costs. The first nine months of
2016 reflected a gain from our debt-reduction actions. The adjusted net
loss2 for the first nine months of 2017 was $173 million, or
$4.07 per diluted share, compared with an adjusted net loss2
of $243 million, or $6.12 per diluted share, for the same period of
2016. The 2017 adjusted net loss2 excluded $38 million of
non-cash derivative losses, $21 million of gains from asset
divestitures, $4 million of gains related to retirements of the
Company's notes and a net $18 million charge from other unusual and
infrequent items. The 2016 adjusted net loss2 excluded $793
million of gains related to retirements of the Company's notes, $243
million of non-cash derivatives losses, a $31 million gain from asset
divestitures, a $63 million tax benefit from a partial reversal of
valuation allowances against CRC's deferred tax assets, a $12 million
interest charge for the write-off of deferred debt issuance costs and a
net $33 million charge for other unusual and infrequent items.
Total daily production volumes averaged 130,000 BOE per day in the first
nine months of 2017, compared with 142,000 BOE per day for the same
period in 2016, a decrease of 8 percent.
In the first nine months of 2017, realized crude oil prices, including
the effect of settled hedges, increased $8.51 per barrel to $49.42 per
barrel from $40.91 per barrel for the same period in 2016. Settled
hedges increased 2017 realized crude oil prices by $0.66 per barrel,
compared with $3.37 per barrel for the same period in 2016. Realized NGL
prices increased 62 percent to $33.00 from $20.36 per barrel in the
first nine months of 2016. Realized natural gas prices increased 25
percent to $2.64 per thousand cubic feet (Mcf), compared with $2.11 per
Mcf for the same period in 2016.
Production costs for the first nine months of 2017 were $649 million, or
$18.31 per BOE, compared with $583 million, or $15.01 per BOE, for the
same period in 2016. Per unit production costs, excluding the effect of
PSC contracts, were $17.21 and $14.18 per BOE for the first nine months
of 2017 and 2016, respectively. The increase in production costs was
driven by higher natural gas and power prices and the ramp-up of
downhole and surface maintenance activity in line with stronger
commodity prices. While higher natural gas prices increase CRC's
production costs for power and steam generation, they result in a net
benefit to the Company due to higher revenue generated from natural gas
sales. Adjusted general and administrative expenses for the first nine
months of 2017 were $187 million, compared with $167 million for the
first nine months of 2016. The increase in adjusted G&A expenses was a
result of higher employee-related costs due to the resumption of
employee benefits and higher costs of performance-based bonus and
incentive compensation plans due to better than expected results.
Taxes other than on income of $103 million for the first nine months of
2017 were $15 million lower than the same period of 2016. Exploration
expense of $17 million for the first nine months of 2017 was $4 million
higher than the same period of 2016.
Capital investment in the first nine months of 2017 totaled $232
million, consisting of $150 million of CRC internally funded capital and
$82 million of BSP capital. Approximately $170 million was directed to
drilling and capital workovers.
Cash provided by operations for the first nine months of 2017 was $225
million and free cash flow3 was $101 million after excluding
capital that was funded by BSP.
3 See Attachment 2 for explanations of how we calculate and
use the non-GAAP measures of Adjusted Net Loss and Free Cash Flow, and
for reconciliations to the nearest GAAP measure, as applicable.
Hedging Update
CRC continues to opportunistically seek hedging transactions to protect
its cash flow, operating margins and capital program and to maintain
liquidity. During the third quarter of 2017, CRC hedged 2018 volumes of
19,000 barrels of oil per day at approximately $60.00 Brent for 2018.
See attachment 8 for more details.
Operational Update and 2017 Capital Investment
Plan
CRC remains on track for its full year total capital plan, which is
inclusive of BSP and MIRA JV capital, of $400 million. The Company
averaged eight rigs in the third quarter of 2017 and is currently
operating nine rigs. Activity has primarily been focused in the San
Joaquin Basin on steamfloods and waterfloods. Within the basin, CRC has
two rigs on steamfloods, three rigs on conventional, one on waterfloods,
and two on unconventional. Additionally, the Company has one part-time
rig drilling waterflood projects in the Los Angeles Basin.
For the fourth quarter of 2017, CRC remains focused on waterflood and
steamflood opportunities primarily in the San Joaquin Basin. The Company
expects to continue deploying JV capital toward its focus areas and
anticipates spudding several exploratory opportunities.
Credit Facility Amendment
We are working with our lender group to amend our 2014 Credit Facility.
The proposed amendment has received approval from each member of the
lender group, subject to federally mandated flood insurance review. The
proposed amendment, if completed, would become effective upon the
satisfaction of certain conditions, including the closing of a new term
loan with minimum proceeds of at least $900 million and minimum
liquidity at closing of $500 million. The proceeds of the new term loan
would be used to repay a portion of the borrowings under the 2014 Credit
Facility. The proposed amendment would, among other things, (i) extend
the maturity date of the 2014 Credit Facility until 2021 (subject to a
potential earlier springing maturity date consistent with our 2014
Credit Facility), (ii) permit the repurchase of up to $100 million of
junior indebtedness, (iii) provide financial covenant relief and (iv)
reduce commitments under the 2014 revolving facility to $1 billion and
the 2014 term loan to $200 million. We can provide no assurances that
the amendment will be signed or will become effective, whether as a
result of flood insurance review or otherwise.
Conference Call Details
To participate in today’s conference call scheduled for 5:00 P.M.
Eastern Standard Time, either dial (877) 328-5505 (International calls
please dial +1 (412) 317-5421) or access via webcast at www.crc.com,
fifteen minutes prior to the scheduled start time to register.
Participants may also pre-register for the conference call at http://dpregister.com/10111633.
A digital replay of the conference call will be archived for
approximately 30 days and supplemental slides for the conference call
will be available online in Investor Relations at www.crc.com.
About California Resources Corporation
California Resources Corporation is the largest oil and natural gas
exploration and production company in California on a gross-operated
basis. The Company operates its world class resource base exclusively
within the State of California, applying complementary and integrated
infrastructure to gather, process and market its production. Using
advanced technology, California Resources Corporation focuses on safely
and responsibly supplying affordable energy for California by
Californians.
Forward-Looking Statements
This presentation contains forward-looking statements that involve risks
and uncertainties that could materially affect our expected results of
operations, liquidity, cash flows and business prospects. Such
statements include those regarding our expectations as to future:
- financial position, liquidity, cash flows and results of operations
- business prospects
- transactions and projects
- operating costs
-
operations and operational results including production, hedging,
capital investment and expected value creation index (VCI) - budgets and maintenance capital requirements
- reserves
- type curves
Actual results may differ from anticipated results, sometimes
materially, and reported results should not be considered an indication
of future performance. While we believe the assumptions or bases
underlying our expectations are reasonable and make them in good faith,
they almost always vary from actual results, sometimes materially.
Factors (but not necessarily all the factors) that could cause results
to differ include:
- commodity price changes
- debt limitations on our financial flexibility
- insufficient cash flow to fund planned investment
-
inability to enter desirable transactions including asset sales and
joint ventures -
legislative or regulatory changes, including those related to
drilling, completion, well stimulation, operation, maintenance or
abandonment of wells or facilities, managing energy, water, land,
greenhouse gases or other emissions, protection of health, safety and
the environment, or transportation, marketing and sale of our products - unexpected geologic conditions
- changes in business strategy
- inability to replace reserves
-
insufficient capital, including as a result of lender restrictions,
unavailability of capital markets or inability to attract potential
investors - inability to enter efficient hedges
- equipment, service or labor price inflation or unavailability
-
availability or timing of, or conditions imposed on, permits and
approvals -
lower-than-expected production, reserves or resources from development
projects or acquisitions or higher-than-expected decline rates -
disruptions due to accidents, mechanical failures, transportation or
storage constraints, natural disasters, labor difficulties, cyber
attacks or other catastrophic events -
factors discussed in “Risk Factors” in our Annual Report on Form 10-K
available on our website at www.crc.com.
Words such as "anticipate," "believe," "continue," "could," "estimate,"
"expect," "goal," "intend," "likely," "may," "might," "plan,"
"potential," "project," "seek," "should," "target, "will" or "would" and
similar words that reflect the prospective nature of events or outcomes
typically identify forward-looking statements. Any forward-looking
statement speaks only as of the date on which such statement is made and
the Company undertakes no obligation to correct or update any
forward-looking statement, whether as a result of new information,
future events or otherwise, except as required by applicable law.
| Attachment 1 | ||||||||||||
| SUMMARY OF RESULTS | ||||||||||||
| Third Quarter | Nine Months | |||||||||||
| ($ and shares in millions, except per share amounts) | 2017 | 2016 | 2017 | 2016 | ||||||||
|
Statement of Operations Data: |
||||||||||||
| Revenues and Other | ||||||||||||
| Oil and gas net sales | $ | 461 | $ | 424 | $ | 1,387 | $ | 1,157 | ||||
| Net derivative (losses) gains | (65 | ) | (14 | ) | 51 | (157 | ) | |||||
| Other revenue | 49 | 46 | 113 | 95 | ||||||||
| Total revenues and other | 445 | 456 | 1,551 | 1,095 | ||||||||
| Costs and Other | ||||||||||||
| Production costs | 222 | 211 | 649 | 583 | ||||||||
| General and administrative expenses | 63 | 58 | 191 | 186 | ||||||||
| Depreciation, depletion and amortization | 134 | 137 | 412 | 422 | ||||||||
| Taxes other than on income | 39 | 37 | 103 | 118 | ||||||||
| Exploration expense | 5 | 3 | 17 | 13 | ||||||||
| Other expenses, net | 29 | 29 | 76 | 76 | ||||||||
| Total costs and other | 492 | 475 | 1,448 | 1,398 | ||||||||
| Operating (Loss) Income | (47 | ) | (19 | ) | 103 | (303 | ) | |||||
| Non-Operating (Loss) Income | ||||||||||||
| Interest and debt expense, net | (85 | ) | (95 | ) | (252 | ) | (243 | ) | ||||
| Net gains on early extinguishment of debt | — | 660 | 4 | 793 | ||||||||
| Gains on asset divestitures | — | — | 21 | 31 | ||||||||
| Other non-operating expense | — | — | (3 | ) | — | |||||||
| (Loss) Income Before Income Taxes | (132 | ) | 546 | (127 | ) | 278 | ||||||
| Income tax benefit | — | — | — | 78 | ||||||||
| Net (Loss) Income | (132 | ) | 546 | (127 | ) | 356 | ||||||
| Net income attributable to noncontrolling interest | (1 | ) | — | (1 | ) | — | ||||||
| Net (Loss) Income Attributable to Common Stock | $ | (133 | ) | $ | 546 | $ | (128 | ) | $ | 356 | ||
| (Loss) Earnings per share attributable to common stock – diluted | $ | (3.11 | ) | $ | 13.04 | $ | (3.01 | ) | $ | 8.79 | ||
| Adjusted Net Loss | $ | (52 | ) | $ | (71 | ) | $ | (173 | ) | $ | (243 | ) |
| Adjusted EPS – diluted | $ | (1.22 | ) | $ | (1.74 | ) | $ | (4.07 | ) | $ | (6.12 | ) |
| Weighted-average common shares outstanding – diluted | 42.7 | 40.8 | 42.5 | 39.7 | ||||||||
| Adjusted EBITDAX | $ | 181 | $ | 164 | $ | 539 | $ | 448 | ||||
| Effective tax rate |
0 |
% |
0 |
% |
0 |
% |
(28) |
% |
||||
|
Cash Flow Data: |
||||||||||||
| Net cash provided by operating activities | $ | 105 | $ | 101 | $ | 225 | $ | 145 | ||||
| Net cash used by investing activities | $ | (100 | ) | $ | (13 | ) | $ | (174 | ) | $ | (31 | ) |
| Net cash provided (used) by financing activities | $ | 14 | $ | (80 | ) | $ | (35 | ) | $ | (116 | ) | |
|
Balance Sheet Data: |
September 30, | December 31, | ||||||||||
| 2017 | 2016 | |||||||||||
| Total current assets | $ | 452 | $ | 425 | ||||||||
| Property, plant and equipment, net | $ | 5,692 | $ | 5,885 | ||||||||
| Current maturities of long-term debt | $ | 100 | $ | 100 | ||||||||
| Other current liabilities | $ | 646 | $ | 626 | ||||||||
| Long-term debt, principal amount | $ | 5,039 | $ | 5,168 | ||||||||
| Total equity | $ | (574 | ) | $ | (557 | ) | ||||||
| Outstanding shares as of | 42.9 | 42.5 | ||||||||||
| Attachment 2 | ||||||||||||
| NON-GAAP FINANCIAL MEASURES AND RECONCILIATIONS | ||||||||||||
|
Our results of operations can include the effects of unusual,
We define adjusted EBITDAX as earnings before interest expense; |
||||||||||||
| ADJUSTED NET LOSS | ||||||||||||
|
The following table presents a reconciliation of the GAAP financial measure of net income (loss) attributable to common stock to the non-GAAP financial measure of adjusted net loss: |
||||||||||||
| Third Quarter | Nine Months | |||||||||||
| ($ millions, except per share amounts) | 2017 | 2016 | 2017 | 2016 | ||||||||
| Net (loss) income attributable to common stock | $ | (133 | ) | $ | 546 | $ | (128 | ) | $ | 356 | ||
| Unusual and infrequent items: | ||||||||||||
| Non-cash derivative losses (gains), excluding noncontrolling interest | 72 | 25 | (38 | ) | 243 | |||||||
| Early retirement, severance and other costs | 1 | 1 | 4 | 19 | ||||||||
| Gains on asset divestitures | — | — | (21 | ) | (31 | ) | ||||||
| Net gains on early extinguishment of debt | — | (660 | ) | (4 | ) | (793 | ) | |||||
| Other | 8 | 5 | 14 | 14 | ||||||||
| Adjusted income items before interest and taxes | 81 | (629 | ) | (45 | ) | (548 | ) | |||||
| Deferred debt issuance costs write-off | — | 12 | — | 12 | ||||||||
| Reversal of valuation allowance for deferred tax assets (a) | — | — | — | (63 | ) | |||||||
| Total | $ | 81 | $ | (617 | ) | $ | (45 | ) | $ | (599 | ) | |
| Adjusted net loss | $ | (52 | ) | $ | (71 | ) | $ | (173 | ) | $ | (243 | ) |
| Net (loss) income attributable to common stock per diluted share | $ | (3.11 | ) | $ | 13.04 | $ | (3.01 | ) | $ | 8.79 | ||
| Adjusted net loss per diluted share | $ | (1.22 | ) | $ | (1.74 | ) | $ | (4.07 | ) | $ | (6.12 | ) |
|
(a) Amount represents the out-of-period portion of the valuation allowance reversal. |
||||||||||||
| DERIVATIVES GAINS AND LOSSES | ||||||||||||
| Third Quarter | Nine Months | |||||||||||
| ($ millions) | 2017 | 2016 | 2017 | 2016 | ||||||||
| Non-cash derivative losses (gains), excluding noncontrolling interest | $ | 72 | $ | 25 | $ | (38 | ) | $ | 243 | |||
| Non-cash derivative losses for noncontrolling interest | 1 | — | 2 | — | ||||||||
| Cash proceeds from settled derivatives | (8 | ) | (11 | ) | (15 | ) | (86 | ) | ||||
| Net derivative losses (gains) | $ | 65 | $ | 14 | $ | (51 | ) | $ | 157 | |||
| FREE CASH FLOW | ||||||||||||
| Third Quarter | Nine Months | |||||||||||
| ($ millions) | 2017 | 2016 | 2017 | 2016 | ||||||||
| Net cash provided by operating activities | $ | 105 | $ | 101 | $ | 225 | $ | 145 | ||||
| Capital investment | (100 | ) | (19 | ) | (232 | ) | (45 | ) | ||||
| Changes in capital accruals | — | 6 | 26 | (5 | ) | |||||||
| Free cash flow, after working capital | 5 | 88 | 19 | 95 | ||||||||
| BSP capital investment | 30 | — | 82 | — | ||||||||
| Free cash flow, excluding BSP capital | $ | 35 | $ | 88 | $ | 101 | $ | 95 | ||||
| ADJUSTED GENERAL AND ADMINISTRATIVE EXPENSES | ||||||||||||
| Third Quarter | Nine Months | |||||||||||
| ($ millions) | 2017 | 2016 | 2017 | 2016 | ||||||||
| General and administrative expenses | $ | 63 | $ | 58 | $ | 191 | $ | 186 | ||||
| Early retirement and severance costs | (1 | ) | (1 | ) | (4 | ) | (19 | ) | ||||
| Adjusted general and administrative expenses | $ | 62 | $ | 57 | $ | 187 | $ | 167 | ||||
| ADJUSTED EBITDAX | ||||||||||||
|
The following tables present a reconciliation of the GAAP financial measures of net income (loss) attributable to common stock and net cash provided (used) by operating activities to the non-GAAP financial measure of adjusted EBITDAX: |
||||||||||||
| Third Quarter | Nine Months | |||||||||||
| ($ millions) | 2017 | 2016 | 2017 | 2016 | ||||||||
| Net (loss) income attributable to common stock | $ | (133 | ) | $ | 546 | $ | (128 | ) | $ | 356 | ||
| Interest and debt expense, net | 85 | 95 | 252 | 243 | ||||||||
| Income tax benefit | — | — | — | (78 | ) | |||||||
|
Depreciation, depletion and amortization, excluding noncontrolling interest |
132 | 137 | 406 | 422 | ||||||||
| Exploration expense | 5 | 3 | 17 | 13 | ||||||||
| Adjusted income items before interest and taxes(c) | 81 | (629 | ) | (45 | ) | (548 | ) | |||||
| Other non-cash items | 11 | 12 | 37 | 40 | ||||||||
| Adjusted EBITDAX (A) | $ | 181 | $ | 164 | $ | 539 | $ | 448 | ||||
| Net cash provided by operating activities | $ | 105 | $ | 101 | $ | 225 | $ | 145 | ||||
| Cash interest | 56 | 64 | 251 | 244 | ||||||||
| Exploration expenditures | 5 | 3 | 16 | 13 | ||||||||
| Other changes in operating assets and liabilities | 7 | (9 | ) | 33 | 32 | |||||||
| Other, net | 8 | 5 | 14 | 14 | ||||||||
| Adjusted EBITDAX (A) | $ | 181 | $ | 164 | $ | 539 | $ | 448 | ||||
| (c) See Adjusted Net Loss reconciliation. | ||||||||||||
| ADJUSTED EBITDAX MARGIN | ||||||||||||
| Third Quarter | Nine Months | |||||||||||
| ($ millions) | 2017 | 2016 | 2017 | 2016 | ||||||||
| Total Revenues | $ | 445 | $ | 456 | $ | 1,551 | $ | 1,095 | ||||
| Non-cash derivative losses (gains) | 73 | 25 | (36 | ) | 243 | |||||||
| Adjusted revenues (B) | $ | 518 | $ | 481 | $ | 1,515 | $ | 1,338 | ||||
| Adjusted EBITDAX Margin (A)/(B) | 35 | % | 34 | % | 36 | % | 33 | % | ||||
Contacts
California Resources Corporation
Scott Espenshade (Investor
Relations)
818-661-6010
[email protected]
or
Margita
Thompson (Media)
818-661-6005
[email protected]


