
California Resources Corporation Announces Fourth Quarter 2017 and Year End Results


LOS ANGELES–(BUSINESS WIRE)–California Resources Corporation (NYSE:CRC) (the Company), an
independent California-based oil and gas exploration and production
company, today reported a net loss attributable to common stock (CRC net
loss) of $138 million, or $3.23 per diluted share, for the fourth
quarter of 2017. The adjusted net loss1 for the fourth
quarter of 2017 was $14 million, or $0.33 per diluted share. For the
full year of 2017, the CRC net loss was $266 million, or $6.26 per
diluted share. The adjusted net loss1 for the full year of
2017 was $187 million, or $4.40 per diluted share.
Adjusted EBITDAX1 for the fourth quarter of 2017 was $222
million and $761 million for the full year of 2017. Cash provided by
operating activities was $23 million for the fourth quarter of 2017 and
$248 million for the full year of 2017. Capital investments for the
fourth quarter of 2017 were $139 million and $371 million for the full
year of 2017, of which $14 million was funded by CRC's joint venture
(JV) partner Benefit Street Partners (BSP) in the fourth quarter and $96
million for the full year. For the full year of 2017, CRC was free cash
flow1 neutral after working capital and excluding capital
that was funded by BSP.
Quarterly Highlights Include:
- Produced 126,000 BOE per day
-
Invested capital of $139 million, of which JV partner BSP funded $14
million -
Drilled 37 wells with internally funded capital and 44 wells with BSP
and Macquarie Infrastructure and Real Assets (MIRA) capital -
Generated adjusted EBITDAX1 of $222 million, reflecting an
adjusted EBITDAX margin1 of 39%
Full Year Highlights Include:
-
Proved reserves of 618 MMBOE, organically replacing 119% of reserves
from the capital program, excluding price revisions - Organic F&D costs of $6.82 per BOE, excluding price revisions
-
Invested capital of $371 million, of which JV partner BSP funded $96
million -
Drilled 110 wells with internally funded capital and 119 wells with
BSP and MIRA funded capital -
Generated adjusted EBITDAX1 of $761 million, reflecting an
adjusted EBITDAX margin1 of 36%
1 See Attachment 2 for explanations of how CRC calculates and
uses the non–GAAP measures of adjusted EBITDAX, adjusted EBITDAX margin,
PV-10, adjusted general and administrative expenses, free cash flow,
production costs (excluding the effects of production sharing-type
contracts (PSC)) and adjusted net loss, and for reconciliations of the
foregoing to their nearest GAAP measure as applicable. VCI is calculated
by dividing the net present value of the project's expected pre-tax cash
flow over its life by the net present value of the related investments,
each using a 10 percent discount rate.
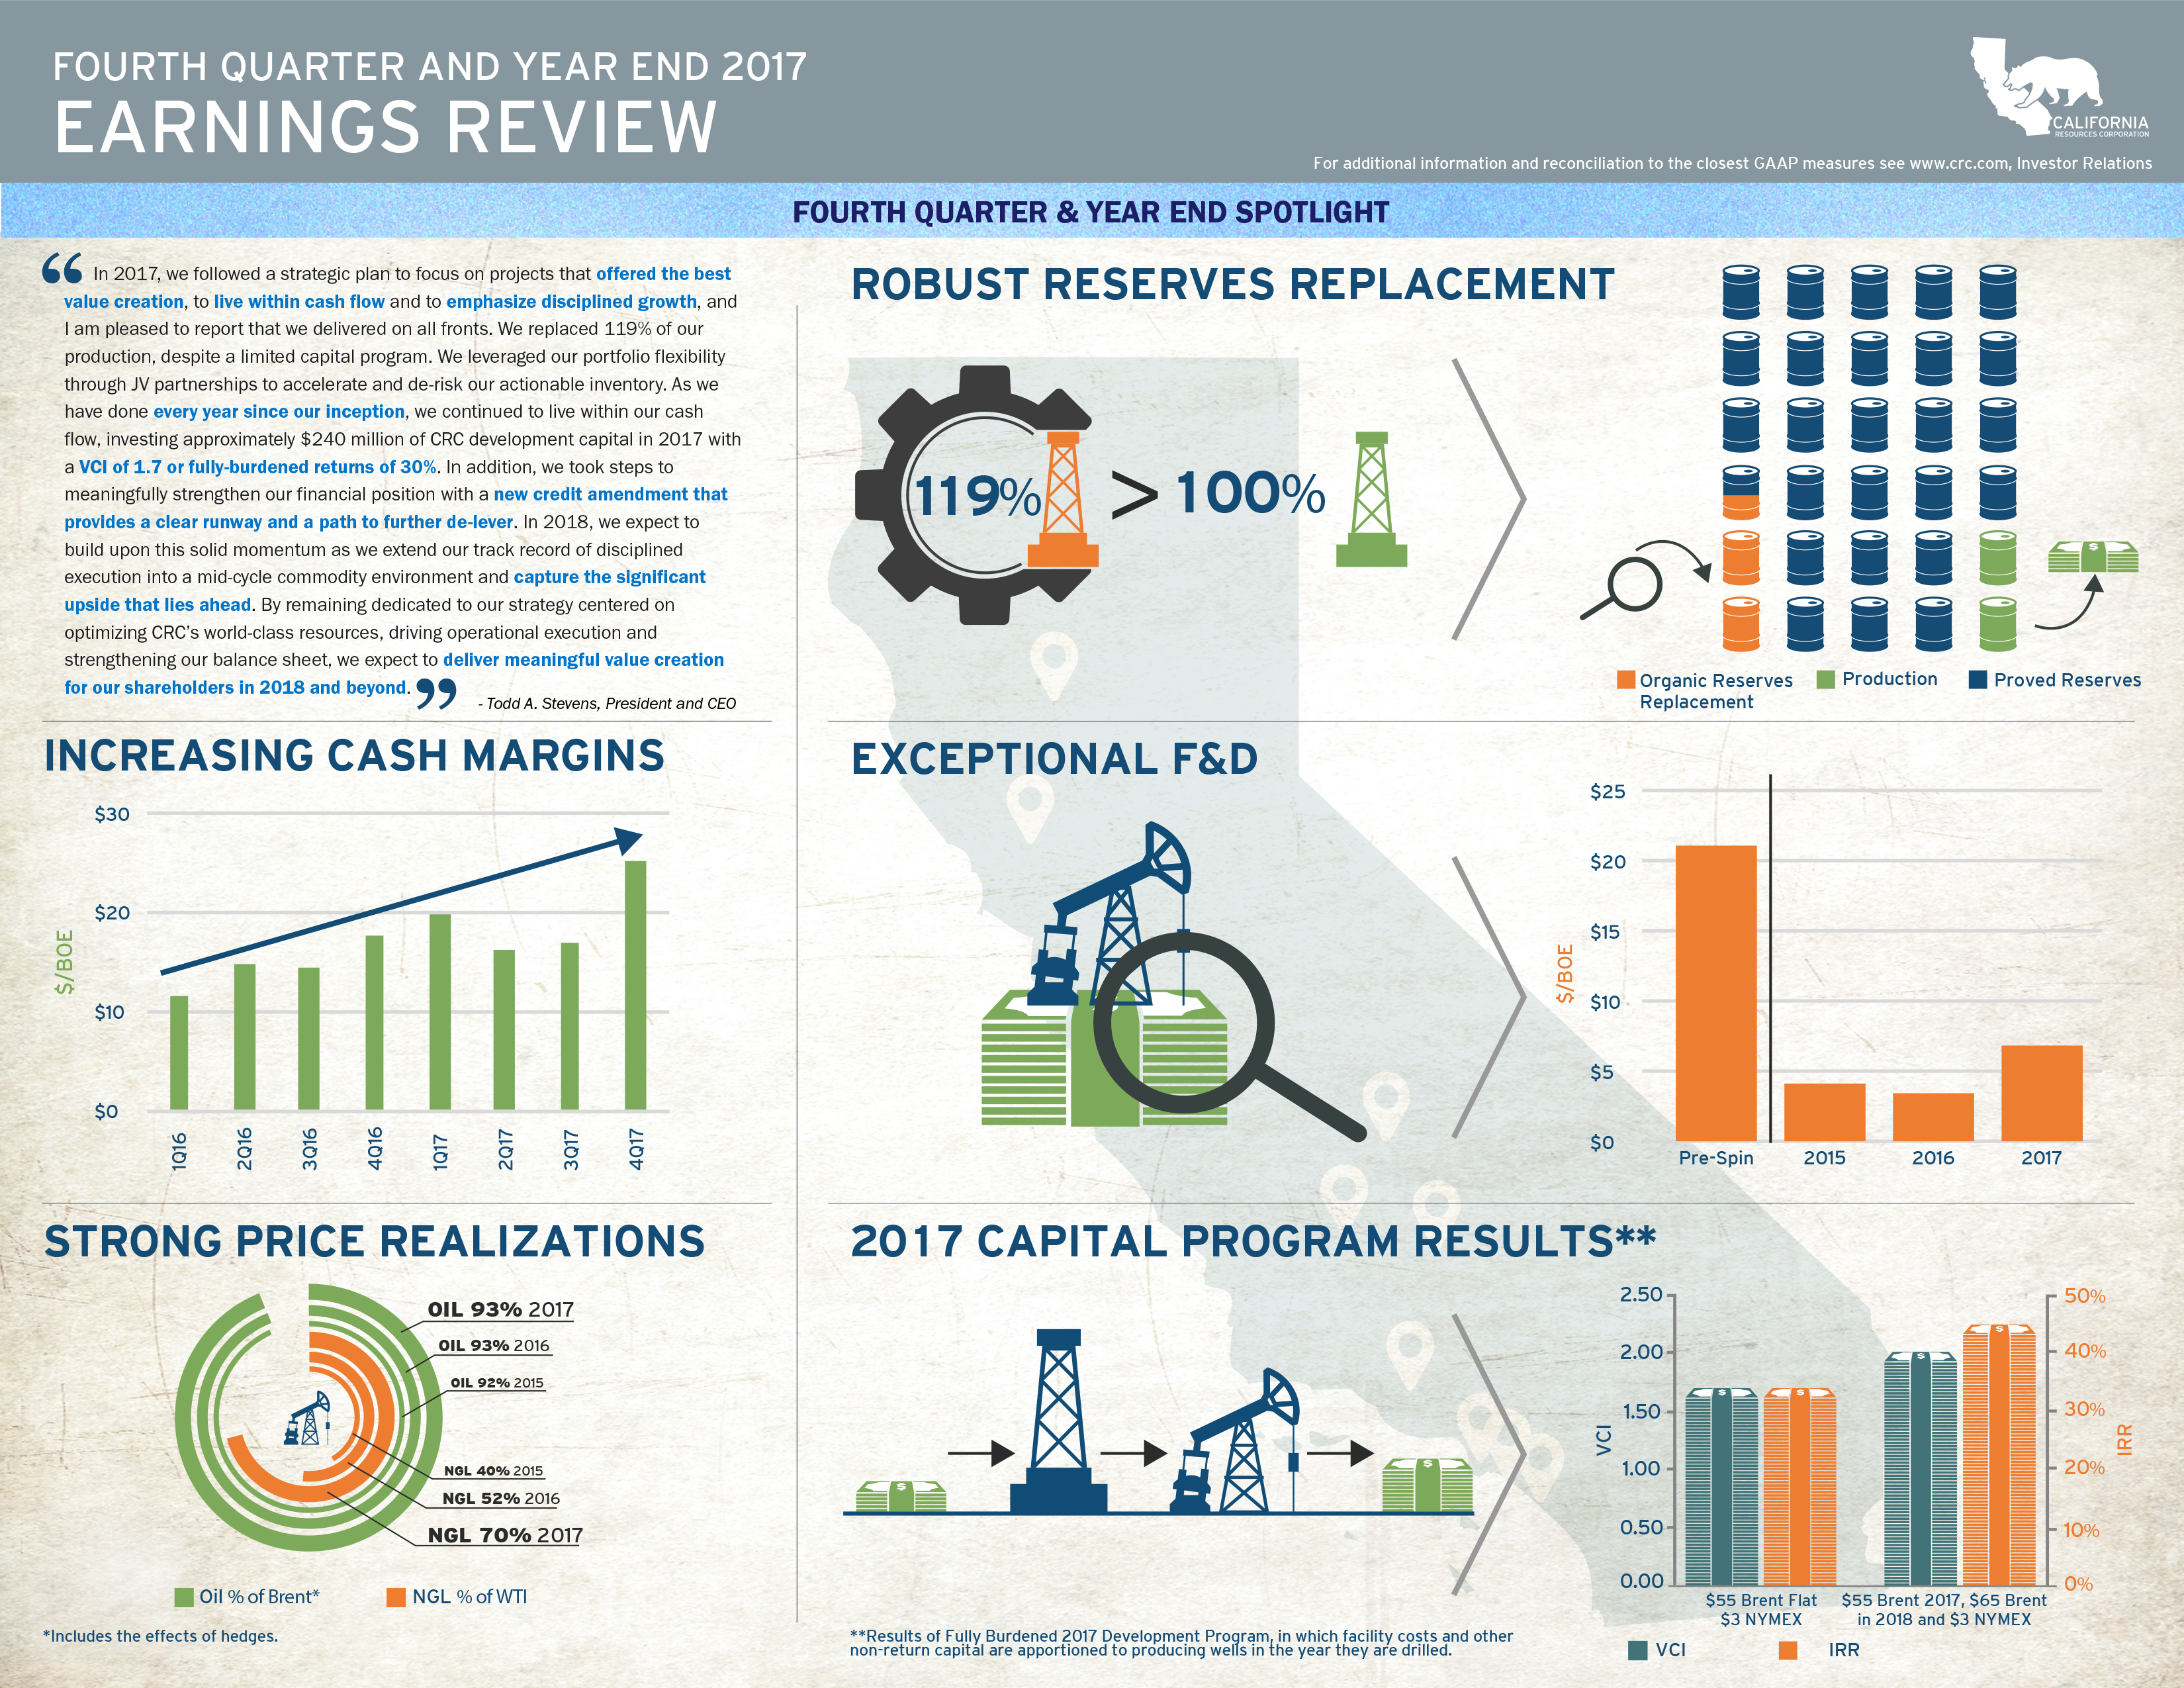
Todd Stevens, CRC's President and Chief Executive Officer, said, "In
2017, we followed a strategic plan to focus on projects that offered the
best value creation, to live within cash flow and to emphasize
disciplined growth, and I am pleased to report that we delivered on all
fronts. We replaced 119% of our production, despite a limited capital
program. We leveraged our portfolio flexibility through JV partnerships
to accelerate and de-risk our actionable inventory. As we have done
every year since our inception, we continued to live within our cash
flow, investing approximately $240 million of CRC development capital in
2017 with a VCI1 of 1.7 or fully-burdened returns of 30%. In
addition, we took steps to meaningfully strengthen our financial
position with a new credit amendment that provides a clear runway and a
path to further de-lever. In 2018, we expect to build upon this solid
momentum as we extend our track record of disciplined execution into a
mid-cycle commodity environment and capture the significant upside that
lies ahead. By remaining dedicated to our strategy centered on
optimizing CRC’s world-class resources, driving operational execution
and strengthening our balance sheet, we expect to deliver meaningful
value creation for our shareholders in 2018 and beyond."
Fourth Quarter 2017 Results
For the fourth quarter of 2017, the CRC net loss was $138 million, or
$3.23 per diluted share, and the adjusted net loss1 was $14
million or $0.33 per diluted share. The adjusted net loss1
excluded $116 million of non-cash derivatives losses and a net $8
million charge for other unusual and infrequent items.
Total daily production volumes averaged 126,000 barrels of oil
equivalent (BOE) per day for the fourth quarter of 2017. Oil volumes
averaged 80,000 barrels per day, NGL volumes averaged 16,000 barrels per
day and gas volumes averaged 179,000 thousand cubic feet (MCF) per day.
These results reflect approximately 1,300 BOE per day of negative PSC
effects due to higher realized prices in the fourth quarter compared to
expected prices, as well as a 700 BOE per day quarterly impact due to
the California wildfires that occurred in December 2017.
Realized crude oil prices, including the effect of settled hedges,
increased by $11.44 per barrel to $56.92 per barrel from the prior year
comparable period. Settled hedges decreased realized crude oil prices by
$2.95 per barrel. Average realized NGL prices registered $44.03 per
barrel and realized natural gas prices were $2.77 per MCF.
Production costs for the fourth quarter of 2017 were $227 million, or
$19.64 per BOE, compared to $17.50 per BOE in the prior year comparable
period. The industry practice for reporting PSCs can result in higher
production costs per barrel as gross field operating costs are matched
with net production. Excluding the PSC effects, per unit production costs1
for the fourth quarter of 2017 would have been $18.31. The increase in
unit based production costs was driven by an increase in energy costs, a
ramp-up of downhole maintenance activity in line with stronger commodity
prices and lower production volumes, but was partially offset by a more
efficient use of energy. General and administrative (G&A) expenses were
$68 million for the fourth quarter of 2017. Adjusted general and
administrative expenses1 for the fourth quarter of 2017 were
$67 million compared to $61 million in the prior year comparable period.
The increase in adjusted G&A expenses1 was a result of
the timing of grants coupled with the higher costs of performance-based
bonus and incentive compensation plans due to better than expected
results.
CRC reported taxes other than on income of $33 million and exploration
expense of $5 million for the fourth quarter of 2017.
Capital investment in the fourth quarter of 2017 totaled $139 million,
consisting of $125 million of internally funded capital and $14 million
of BSP funded capital. Approximately $95 million was directed to
drilling and capital workovers.
Cash provided by operating activities was $23 million.
Full Year 2017 Results
For the full year of 2017, the CRC net loss was $266 million, or $6.26
per diluted share. The adjusted net loss1 was $187 million,
or $4.40 per diluted share, which excluded $78 million of non-cash
derivative losses, $21 million of gains from asset divestitures, $4
million of net gains on early retirement of debt and a $26 million net
charge from other unusual and infrequent items.
Total daily production volumes averaged 129,000 BOE per day for the full
year of 2017. Oil volumes averaged 83,000 barrels per day, NGL volumes
averaged 16,000 barrels per day, and gas volumes averaged 182,000 MCF
per day.
Realized crude oil prices, including the effect of settled hedges,
increased $9.23 per barrel to $51.24 per barrel from $42.01 per barrel
in 2016. Settled hedges decreased 2017 realized crude oil prices by
$0.23 per barrel compared with a $2.29 per barrel increase in 2016.
Realized NGL prices increased 60% to $35.76 from $22.39 per barrel in
2016. Realized natural gas prices increased 17% to $2.67 per MCF
compared with $2.28 per MCF in 2016.
Production costs for the full year of 2017 were $876 million, or $18.64
per BOE. Per unit production costs, excluding the effect of PSCs1,
were $17.48 per BOE. The increase in production costs of $76 million
from the prior year was driven by an increase in energy costs and a
ramp-up of downhole and surface maintenance activity in line with
stronger commodity prices, but were partially offset by a more efficient
use of energy. While higher natural gas prices increase CRC's production
costs for power and steam generation, they result in a net benefit due
to higher revenue generated from natural gas sales. G&A expenses were
$259 million for the full year of 2017. Adjusted G&A expenses1
for the full year of 2017 were $254 million compared to $228 million in
2016. The increase in adjusted G&A expenses1 was a result
of the timing of grants coupled with the higher costs of
performance-based bonus and incentive compensation plans due to better
than expected results.
CRC reported taxes other than on income of $136 million and exploration
expense of $22 million for the full year of 2017.
Capital investment in 2017 totaled $371 million, consisting of $275
million of CRC internally funded capital and $96 million of BSP funded
capital. Approximately $266 million was directed to drilling and capital
workovers. The Company's MIRA joint venture funded an additional $58
million of investment.
Cash provided by operating activities for the full year of 2017 was $248
million. The Company was free cash flow1 neutral after
working capital and excluding capital that was funded by BSP.
Operational Update
CRC operated an average of nine rigs during the fourth quarter of 2017
and drilled 81 wells, including those drilled with BSP and MIRA capital,
which consisted of 75 development wells (36 steamflood, 25 waterflood,
13 primary and one unconventional) and six exploration wells (five
steamflood and one primary). Most of the drilling activity was directed
toward steamfloods and waterfloods, which have different production
profiles and longer response times than typical conventional wells. As a
result, the full production contribution is not typically experienced in
the same year that the well is drilled. In the San Joaquin basin, CRC
operated seven rigs and produced approximately 88 MBOE per day for the
fourth quarter. The Los Angeles basin had one rig directed toward
waterflood projects, and contributed 26 MBOE per day of production in
the fourth quarter of 2017. The impact of the production sharing
agreements in Long Beach decreased production by 1,300 BOE per day in
the fourth quarter due to fewer cost-recovery barrels as a result of
higher oil prices than initially expected. The Ventura basin activity
included one rig focused on conventional projects and produced
approximately 6,000 BOE per day for the fourth quarter. The California
wildfires negatively impacted production by approximately 2,200 BOE per
day in December 2017 and production remained affected by approximately
1,200 BOE per day in January 2018 due to third party power and access
issues related to the fires and subsequent mudslides. First quarter of
2018 production guidance reflects a 400 BOE per day reduction primarily
due to these issues, a 600 BOE per day impact for PSC effects, as well
as other factors. CRC had no development drilling activity in the
Sacramento basin and continues to focus on oil weighted projects.
Balance Sheet Strengthening Update
During February 2018, CRC entered into a midstream joint venture with an
affiliate of Ares Management, L.P. For more details on the transaction,
please see CRC's press release and Form 8-K dated February 7, 2018.
Year-End 2017 Reserves and PV-10 Value1
CRC's proved reserves totaled 618 MMBOE as of the end of 2017, up from
568 MMBOE at year-end 2016. Excluding positive price revisions, the
Company organically replaced 119% of proved reserves. This strong
reserve replacement ratio (RRR)** was achieved with a limited, well
executed capital program for the year, in addition to positive
performance revisions primarily in Huntington Beach and Buena Vista
Area. A total of approximately 34 MMBOE of additions were related to
extensions and discoveries in several CRC fields and another 22 MMBOE
was added through positive performance revisions. All-in 2017 Finding
and Development (F&D) costs were $3.94 per BOE in 2017, including price
revisions. Organic F&D costs were $6.82 per BOE in 2017, which exclude
price revisions.
Summary of Changes in Proved Reserves Based on the SEC Price Deck*
(Million BOE)
| Balance at December 31, 2016 | 568 | |
| Revisions Related to Performance | 22 | |
| Extensions and Discoveries | 34 | |
| Sales | (8 | ) |
| Revisions Related to Price | 49 | |
| Production | (47 | ) |
| Balance at December 31, 2017 | 618 | |
| 2017 Organic Finding and Development Cost** | $ | 6.82 |
*Calculated using the first-day-of-the-month twelve-month average Brent
oil price of $54.42 per barrel and NYMEX natural gas price of $2.98 per
Million British Thermal Units (MMBTU), before adjustments for gravity,
quality and transportation costs, in accordance with Securities and
Exchange Commission (SEC) rules and regulations.
** See calculation
of RRR and F&D on Attachment 3.
The present value of CRC's proved reserves as of December 31, 2017 was
approximately $4.5 billion on a pre-tax basis, discounted at 10% (PV-101).
2018 Capital Budget
With stronger expected cash flows, CRC estimates its 2018 capital
program will range from $425 million to $450 million, which includes
approximately $100 to $150 million in JV capital. CRC's 2018 capital
program may grow further through the use of cash on the balance sheet,
additional tranches from existing JVs as well as potential new JVs.
CRC’s direct investment level will be largely directed to waterflood and
steamflood investments which will drive enhanced production into 2019.
Credit Facility Amendment
CRC entered into its seventh amendment of the 2014 Credit Facility in
November 2017. This amendment received unanimous approval from all 29
lenders and financial institutions and became effective after the
closing of a new $1.3 billion first lien secured term loan facility
(“2017 Term Loan”). Net proceeds were used to pay the $559 million
remaining balance of the 2014 Term Loan, reduce the balance of the 2014
Revolving Credit Facility and pay accrued interest. The amendment
extended the maturity date of the 2014 Revolving Credit Facility to June
30, 2021 and modified some of its covenants. Subsequent to the
amendment, CRC was able to eliminate the springing maturity features
related to the 5% notes due January 15, 2020 and the 5 ½% notes due
September 15, 2021 by buying back $65 million of principal of the 5%
Notes and $35 million in principal of the 5 ½% Notes. For more details
on the amendment, please see the Company's Form 8-K disclosure dated
November 17, 2017.
Conference Call Details
To participate in today’s conference call scheduled for 5:00 P.M.
Eastern Standard Time, either dial (877) 328-5505 (International calls
please dial +1 (412) 317-5421) or access via webcast at www.crc.com,
fifteen minutes prior to the scheduled start time to register.
Participants may also pre-register for the conference call at http://dpregister.com/10115435.
A digital replay of the conference call will be archived for
approximately 30 days and supplemental slides for the conference call
will be available online in the Investor Relations section of www.crc.com.
About California Resources Corporation
California Resources Corporation is the largest oil and natural gas
exploration and production company in California on a gross-operated
basis. The Company operates its world-class resource base exclusively
within the State of California, applying complementary and integrated
infrastructure to gather, process and market its production. Using
advanced technology, California Resources Corporation focuses on safely
and responsibly supplying affordable energy for California by
Californians.
Forward-Looking Statements
This presentation contains forward-looking statements that involve risks
and uncertainties that could materially affect CRC's expected results of
operations, liquidity, cash flows and business prospects. Such
statements include those regarding the Company's expectations as to
future:
- financial position, liquidity, cash flows and results of operations
- business prospects
- transactions and projects
- operating costs
-
operations and operational results including production, hedging,
capital investment and expected value creation index (VCI) - budgets and maintenance capital requirements
- reserves
- type curves
Actual results may differ from anticipated results, sometimes
materially, and reported results should not be considered an indication
of future performance. While CRC believes the assumptions or bases
underlying our expectations are reasonable and make them in good faith,
they almost always vary from actual results, sometimes materially.
Factors (but not necessarily all the factors) that could cause results
to differ include:
- commodity price changes
- debt limitations on its financial flexibility
- insufficient cash flow to fund planned investment
-
inability to enter desirable transactions including asset sales and
joint ventures -
legislative or regulatory changes, including those related to
drilling, completion, well stimulation, operation, maintenance or
abandonment of wells or facilities, managing energy, water, land,
greenhouse gases or other emissions, protection of health, safety and
the environment, or transportation, marketing and sale of our products - unexpected geologic conditions
- changes in business strategy
- inability to replace reserves
-
insufficient capital, including as a result of lender restrictions,
unavailability of capital markets or inability to attract potential
investors - inability to enter efficient hedges
- equipment, service or labor price inflation or unavailability
-
availability or timing of, or conditions imposed on, permits and
approvals -
lower-than-expected production, reserves or resources from development
projects or acquisitions or higher-than-expected decline rates -
disruptions due to accidents, mechanical failures, transportation or
storage constraints, natural disasters, labor difficulties, cyber
attacks or other catastrophic events -
factors discussed in “Risk Factors” in CRC's Annual Report on Form
10-K available on its website at www.crc.com.
Words such as "anticipate," "believe," "continue," "could," "estimate,"
"expect," "goal," "intend," "likely," "may," "might," "plan,"
"potential," "project," "seek," "should," "target," "will" or "would"
and similar words that reflect the prospective nature of events or
outcomes typically identify forward-looking statements. Any
forward-looking statement speaks only as of the date on which such
statement is made and the Company undertakes no obligation to correct or
update any forward-looking statement, whether as a result of new
information, future events or otherwise, except as required by
applicable law.
| Attachment 1 | ||||||||||||
| SUMMARY OF RESULTS | ||||||||||||
| Fourth Quarter | Twelve Months | |||||||||||
| ($ and shares in millions, except per share amounts) | 2017 | 2016 | 2017 | 2016 | ||||||||
|
Statement of Operations Data: |
||||||||||||
| Revenues and Other | ||||||||||||
| Oil and gas net sales | $ | 549 | $ | 464 | $ | 1,936 | $ | 1,621 | ||||
| Net derivative losses | (141 | ) | (49 | ) | (90 | ) | (206 | ) | ||||
| Other revenue | 47 | 37 | 160 | 132 | ||||||||
| Total revenues and other | 455 | 452 | 2,006 | 1,547 | ||||||||
| Costs and Other | ||||||||||||
| Production costs | 227 | 217 | 876 | 800 | ||||||||
| General and administrative expenses | 68 | 62 | 259 | 248 | ||||||||
| Depreciation, depletion and amortization | 132 | 137 | 544 | 559 | ||||||||
| Taxes other than on income | 33 | 26 | 136 | 144 | ||||||||
| Exploration expense | 5 | 10 | 22 | 23 | ||||||||
| Other expenses, net | 30 | 3 | 106 | 79 | ||||||||
| Total costs and other | 495 | 455 | 1,943 | 1,853 | ||||||||
| Operating (Loss) Income | (40 | ) | (3 | ) | 63 | (306 | ) | |||||
| Non-Operating (Loss) Income | ||||||||||||
| Interest and debt expense, net | (91 | ) | (85 | ) | (343 | ) | (328 | ) | ||||
| Net gains on early extinguishment of debt | — | 12 | 4 | 805 | ||||||||
| (Losses) gains on asset divestitures | — | (1 | ) | 21 | 30 | |||||||
| Other non-operating expense | (4 | ) | — | (7 | ) | — | ||||||
| (Loss) Income Before Income Taxes | (135 | ) | (77 | ) | (262 | ) | 201 | |||||
| Income tax benefit | — | — | — | 78 | ||||||||
| Net (Loss) Income | (135 | ) | (77 | ) | (262 | ) | 279 | |||||
| Net income attributable to noncontrolling interest | (3 | ) | — | (4 | ) | — | ||||||
| Net (Loss) Income Attributable to Common Stock | $ | (138 | ) | $ | (77 | ) | $ | (266 | ) | $ | 279 | |
|
Net (loss) income attributable to common stock per share – basic and diluted |
$ | (3.23 | ) | $ | (1.83 | ) | $ | (6.26 | ) | $ | 6.76 | |
| Adjusted net loss | $ | (14 | ) | $ | (74 | ) | $ | (187 | ) | $ | (317 | ) |
| Adjusted net loss per diluted share | $ | (0.33 | ) | $ | (1.76 | ) | $ | (4.40 | ) | $ | (7.85 | ) |
| Weighted-average common shares outstanding – diluted | 42.7 | 42.1 | 42.5 | 40.4 | ||||||||
| Adjusted EBITDAX | $ | 222 | $ | 168 | $ | 761 | $ | 616 | ||||
| Effective tax rate | 0 | % | 0 | % | 0 | % | (39 | )% | ||||
|
Cash Flow Data: |
||||||||||||
| Net cash provided (used) by operating activities | $ | 23 | $ | (15 | ) | $ | 248 | $ | 130 | |||
| Net cash used in investing activities | $ | (139 | ) | $ | (30 | ) | $ | (313 | ) | $ | (61 | ) |
| Net cash provided (used) by financing activities | $ | 108 | $ | 47 | $ | 73 | $ | (69 | ) | |||
|
Balance Sheet Data: |
December 31, | December 31, | ||||||||||
| 2017 | 2016 | |||||||||||
| Total current assets | $ | 483 | $ | 425 | ||||||||
| Total property, plant and equipment, net | $ | 5,696 | $ | 5,885 | ||||||||
| Current maturities of long-term debt | $ | — | $ | 100 | ||||||||
| Other current liabilities | $ | 732 | $ | 626 | ||||||||
| Long-term debt, principal amount | $ | 5,306 | $ | 5,168 | ||||||||
| Total equity | $ | (720 | ) | $ | (557 | ) | ||||||
| Outstanding shares as of | 42.9 | 42.5 | ||||||||||
| Attachment 2 | ||||||||||||
| NON-GAAP FINANCIAL MEASURES AND RECONCILIATIONS | ||||||||||||
|
Our results of operations can include the effects of unusual, out-of-period and infrequent transactions and events affecting earnings that vary widely and unpredictably in nature, timing, amount and frequency. Therefore, management uses measures called adjusted net income (loss) and adjusted general and administrative expenses, both which exclude those items. These measures are not meant to disassociate items from management's performance, but rather are meant to provide useful information to investors interested in comparing our performance between periods. Reported earnings are considered representative of management's performance over the long term. Adjusted net income (loss) and adjusted general and administrative expenses are not considered to be alternatives to net income (loss) or general and administrative expenses, respectively, reported in accordance with U.S. generally accepted accounting principles (GAAP). |
||||||||||||
|
We define adjusted EBITDAX as earnings before interest expense; income taxes; depreciation, depletion and amortization; exploration expense; other unusual, out-of-period and infrequent items and other non-cash items. We believe adjusted EBITDAX provides useful information in assessing our financial condition, results of operations and cash flows and is widely used by the industry, the investment community and our lenders. While adjusted EBITDAX is a non-GAAP measure, the amounts included in the calculation of adjusted EBITDAX were computed in accordance with GAAP. This measure is a material component of certain of our financial covenants under our 2014 revolving credit facility and is provided in addition to, and not as an alternative for, income and liquidity measures calculated in accordance with GAAP. Certain items excluded from adjusted EBITDAX are significant components in understanding and assessing our financial performance, such as our cost of capital and tax structure, as well as the historic cost of depreciable and depletable assets. Adjusted EBITDAX should be read in conjunction with the information contained in our financial statements prepared in accordance with GAAP. |
||||||||||||
| ADJUSTED NET LOSS | ||||||||||||
|
The following table presents a reconciliation of the GAAP financial measure of net income (loss) attributable to common stock to the non-GAAP financial measure of adjusted net loss: |
||||||||||||
| Fourth Quarter | Twelve Months | |||||||||||
| ($ millions, except per share amounts) | 2017 | 2016 | 2017 | 2016 | ||||||||
| Net (loss) income attributable to common stock | $ | (138 | ) | $ | (77 | ) | $ | (266 | ) | $ | 279 | |
| Unusual and infrequent items: | ||||||||||||
| Non-cash derivative losses (gains), excluding noncontrolling interest | 116 | 40 | 78 | 283 | ||||||||
| Early retirement, severance and other costs | 1 | 1 | 5 | 20 | ||||||||
| Losses (gains) on asset divestitures | — | 1 | (21 | ) | (30 | ) | ||||||
| Net gains on early extinguishment of debt | — | (12 | ) | (4 | ) | (805 | ) | |||||
| Other | 7 | (27 | ) | 21 | (13 | ) | ||||||
| Total unusual and infrequent items | 124 | 3 | 79 | (545 | ) | |||||||
| Deferred debt issuance costs write-off | — | — | — | 12 | ||||||||
| Reversal of valuation allowance for deferred tax assets (a) | — | — | — | (63 | ) | |||||||
| Adjusted net loss | $ | (14 | ) | $ | (74 | ) | $ | (187 | ) | $ | (317 | ) |
| Net (loss) income attributable to common stock per diluted share | $ | (3.23 | ) | $ | (1.83 | ) | $ | (6.26 | ) | $ | 6.76 | |
| Adjusted net loss per diluted share | $ | (0.33 | ) | $ | (1.76 | ) | $ | (4.40 | ) | $ | (7.85 | ) |
|
(a) Amount represents the out-of-period portion of the valuation allowance reversal. |
||||||||||||
| DERIVATIVES GAINS AND LOSSES | ||||||||||||
| Fourth Quarter | Twelve Months | |||||||||||
| ($ millions) | 2017 | 2016 | 2017 | 2016 | ||||||||
| Non-cash derivative losses, excluding noncontrolling interest | $ | (116 | ) | $ | (40 | ) | $ | (78 | ) | $ | (283 | ) |
| Non-cash derivative losses for noncontrolling interest | (3 | ) | — | (5 | ) | — | ||||||
| Cash (payments) proceeds from settled derivatives | (22 | ) | (9 | ) | (7 | ) | 77 | |||||
| Net derivative losses | $ | (141 | ) | $ | (49 | ) | $ | (90 | ) | $ | (206 | ) |
| FREE CASH FLOW | ||||||||||||
| Fourth Quarter | Twelve Months | |||||||||||
| ($ millions) | 2017 | 2016 | 2017 | 2016 | ||||||||
| Net cash provided (used) by operating activities | $ | 23 | $ | (15 | ) | $ | 248 | $ | 130 | |||
| Capital investment | (139 | ) | (31 | ) | (371 | ) | (75 | ) | ||||
| Changes in capital accruals | 1 | (1 | ) | 27 | (6 | ) | ||||||
| Free cash flow, after working capital | (115 | ) | (47 | ) | (96 | ) | 49 | |||||
| BSP funded capital investment | 14 | — | 96 | — | ||||||||
| Free cash flow, excluding BSP funded capital | $ | (101 | ) | $ | (47 | ) | $ | — | $ | 49 | ||
| ADJUSTED GENERAL AND ADMINISTRATIVE EXPENSES | ||||||||||||
| Fourth Quarter | Twelve Months | |||||||||||
| ($ millions) | 2017 | 2016 | 2017 | 2016 | ||||||||
| General and administrative expenses | $ | 68 | $ | 62 | $ | 259 | $ | 248 | ||||
| Early retirement and severance costs | (1 | ) | (1 | ) | (5 | ) | (20 | ) | ||||
| Adjusted general and administrative expenses | $ | 67 | $ | 61 | $ | 254 | $ | 228 | ||||
| ADJUSTED EBITDAX | ||||||||||||
|
The following tables present a reconciliation of the GAAP financial measures of net income (loss) attributable to common stock and net cash provided (used) by operating activities to the non-GAAP financial measure of adjusted EBITDAX: |
||||||||||||
| Fourth Quarter | Twelve Months | |||||||||||
| ($ millions) | 2017 | 2016 | 2017 | 2016 | ||||||||
| Net (loss) income attributable to common stock | $ | (138 | ) | $ | (77 | ) | $ | (266 | ) | $ | 279 | |
| Interest and debt expense, net | 91 | 85 | 343 | 328 | ||||||||
| Income tax benefit | — | — | — | (78 | ) | |||||||
|
Depreciation, depletion and amortization, excluding noncontrolling interest |
129 | 137 | 535 | 559 | ||||||||
| Exploration expense | 5 | 10 | 22 | 23 | ||||||||
| Unusual and infrequent items (c) | 124 | 3 | 79 | (545 | ) | |||||||
| Other non-cash items | 11 | 10 | 48 | 50 | ||||||||
| Adjusted EBITDAX (A) | $ | 222 | $ | 168 | $ | 761 | $ | 616 | ||||
| Net cash provided (used) by operating activities | $ | 23 | $ | (15 | ) | $ | 248 | $ | 130 | |||
| Cash interest | 145 | 140 | 396 | 384 | ||||||||
| Exploration expenditures | 4 | 7 | 20 | 20 | ||||||||
| Changes in operating assets and liabilities | 43 | 63 | 76 | 95 | ||||||||
| Other, net | 7 | (27 | ) | 21 | (13 | ) | ||||||
| Adjusted EBITDAX (A) | $ | 222 | $ | 168 | $ | 761 | $ | 616 | ||||
| (c) See Adjusted Net Loss reconciliation. | ||||||||||||
| ADJUSTED EBITDAX MARGIN | ||||||||||||
| Fourth Quarter | Twelve Months | |||||||||||
| ($ millions) | 2017 | 2016 | 2017 | 2016 | ||||||||
| Total Revenues | $ | 455 | $ | 452 | $ | 2,006 | $ | 1,547 | ||||
| Non-cash derivative losses | 119 | 40 | 83 | 283 | ||||||||
| Adjusted revenues (B) | $ | 574 | $ | 492 | $ | 2,089 | $ | 1,830 | ||||
| Adjusted EBITDAX Margin (A)/(B) | 39 | % | 34 | % | 36 | % | 34 | % | ||||
| PRODUCTION COSTS PER BOE | ||||||||||||
| Fourth Quarter | Twelve Months | |||||||||||
|
($ per BOE) |
2017 | 2016 | 2017 | 2016 | ||||||||
| Production Costs |
$ |
19.64 |
$ | 17.50 | $ | 18.64 | $ | 15.61 | ||||
| Costs attributable to PSC type contracts | (1.33 | ) | (1.21 | ) | (1.16 | ) | (0.92 | ) | ||||
| Production Costs, excluding the effects of PSC type contracts |
$ |
18.31 |
$ | 16.29 | $ | 17.48 | $ | 14.69 | ||||
Contacts
California Resources Corporation
Scott Espenshade (Investor
Relations)
818-661-6010
[email protected]
or
Margita
Thompson (Media)
818-661-6005
[email protected]


